
Your Weekly Update for Monday, August 3, 2026.
Beacon Rock Wealth Advisors is a dba of BR Capital, Inc. It is a financial planning and registered investment advisory firm in Camas, Washington. We are always available to answer your questions. Give us a call at (360) 735-1900 or send an email.
If you or someone you know is worried about retirement, send us an email or give us a call for a no-obligation Retirement and Social Security Analysis.
If this information is helpful to you, please forward this to a friend and ask them to subscribe at https://newsletters.beaconrwa.com/subscribe.
Have a great week!
Bill Roller
NMLS #107972
CHARTERED FINANCIAL ANALYST
CERTIFIED FINANCIAL PLANNERTM
CHARTERED MARKET TECHNICIAN
bill.roller@beaconrwa.com
Summary
Markets were UP last week. The Dow Jones Industrial Average was UP 1.04% to 52,485.03 while the S&P500 ended UP 1.05% to 7,489.72. The Nasdaq Composite ROSE 1.05% to 25,373.85. The annual yield on the 30-year Treasury ROSE 11.3 basis point(s) to 5.275%.
Last Week
Closing Stock Market Summary: Amazon picks up where Microsoft left off
What Microsoft (MSFT 464.72, +13.62, +3.02%) and the semiconductors did for the stock market on Thursday, Amazon (AMZN 271.58, +36.08, +15.32%) and several of its mega-cap brethren did for the stock market on Friday.
It was an impressive follow-up act that had a similar overlay, right down to the opposing force of a mega-cap laggard. On Thursday, that laggard was Meta Platforms (META 556.71, +17.68, +3.28%). Today, it was Apple (AAPL 308.91, -24.52, -7.35%), which was sent packing after providing disappointing fiscal Q4 revenue guidance that it attributed to supply constraints and negative FX effects.
Fortunately, Apple’s struggles did not pull down the market, partly because there was a recognition that Apple’s problem is a supply problem and not a demand problem. At the same time, other mega-cap leaders, namely Alphabet (GOOG 356.65, +22.97, +6.88%), NVIDIA (NVDA 200.75, +5.71, +2.93%), and Microsoft, flexed their muscles, and along with Amazon, more than made up for Apple’s losses.
Today’s session started in a roller-coaster fashion. The S&P 500 ran up to 7,490, but no sooner had it done that than it was back at 7,400, undercut by a steady rise in Treasury yields, rising oil prices, and a rollover by the semiconductor stocks, which had a boisterous start on the heels of a 17.9% gain in South Korea’s Kospi Index that was led by SK Hynix and Samsung Electronics.
Treasury yields and oil prices remained elevated throughout today’s trade, and semiconductors, as a group, stalled, yet the stock market made a steady advance for most of today’s session that saw the S&P 500 scale the wall at 7,500 shortly before today’s close, only to lose that ground in the last minute of trading.
The 10-yr note yield, for its part, jumped eight basis points today to 4.75%, leaving it up 33 basis points for the month in a move that coincided with rising oil prices. WTI crude futures settled today up 1.2% at $84.57/bbl but rose 21% in July.
That move fueled the S&P 500 energy sector, which was the market’s best-performing sector this month, gaining 12.6%.
Like Thursday, participation in the stock market’s advance was fairly narrow. Breadth favored decliners by a slim margin at the NYSE and Nasdaq. The Russell 2000 was down 0.5%; the equal-weighted S&P 500 was down 0.2%; and seven of the 11 S&P 500 sectors finished lower. The two best-performing sectors today were the consumer discretionary (+6.1%) and communication services (+4.6%), which were led by Amazon and Alphabet, respectively.
- Russell 2000: +18.1% YTD
- S&P MidCap 400: +13.8% YTD
- S&P 500: +9.4% YTD
- Nasdaq Composite: +9.2% YTD
- DJIA: +9.1% YTD
Reviewing Friday’s data:
- The Q2 Employment Cost Index increased 0.9% (Briefing.com consensus: 0.8%) on the heels of a 0.9% increase in Q1, with wages and salaries up 0.9% and benefit costs up 1.0%. The key takeaway from the report is that wages and salaries for civilian workers, up 3.2% year-over-year, are not keeping up with inflation. That could eventually lead to reduced discretionary spending activity.
- The final reading for the University of Michigan Consumer Sentiment Index for July increased to 55.2 (Briefing.com consensus: 54.4) from the preliminary reading of 54.4 and the final reading of 49.5 for June. In the same period a year ago, the index stood at 61.7. The key takeaway from the report is that sentiment held okay in July, even as gas prices started to rise again amid increased military hostilities between the U.S. and Iran.
- July Chicago PMI 57.6 vs. 56.5 Briefing.com consensus; prior 56.7
This Week
S&P futures vs fair value: +15.00. Nasdaq futures vs fair value: -118.00.
Equity futures point to a mostly higher open to start the week, with some enthusiasm coming from a slide in oil prices after President Trump called off planned strikes against Iran. NBC News reports that President Trump said new talks will begin with Iran today, and crude oil is currently down $5.28 (-6.2%) to $79.39 per barrel.
Stocks are coming off a mostly higher finish to a volatile week following strong earnings from Microsoft (MSFT 475.00, +10.28, +2.2%) and Amazon (AMZN 276.83, +5.25, +1.9%), which also helped reignite some enthusiasm around the AI-buildout cycle.
This week will also see a sizable chunk of S&P 500 companies report earnings, including several large chipmaker names along with SpaceX (SPCX 106.30, -2.07, -1.9%).
On the data front, investors will receive the final S&P Global U.S. Manufacturing PMI for July at 9:45 a.m. ET, followed by June Construction Spending and the July ISM Manufacturing Index at 10:00 a.m.
In corporate news:
- Alibaba (BABA 37, +5.12, +4.2%) introduced a new Qwen3.8-Max AI model, according to Bloomberg.
- AstraZeneca (AZN 30, -7.34, -4.3%) is in discussions to combine with Bristol Myers Squibb (BMY 68.50, +3.19, +4.9%), according toFinancial Times.
- Marriott (MAR 85, -12.98, -3.5%) beat EPS expectations by $0.11, missed revenue expectations, and guided Q3 EPS below consensus, with FY26 EPS above consensus.
Reviewing overnight developments:
Equity indices in the Asia-Pacific region had a mixed showing on Monday with South Korea’s Kospi (-5.1%) giving back some of its big gains from Friday. Japan’s Nikkei: -0.9%, Hong Kong’s Hang Seng: +0.5%, China’s Shanghai Composite: -0.6%, India’s Sensex: +0.7%, South Korea’s Kospi: -5.1%, Australia’s ASX All Ordinaries: +0.5%.
In news:
- The U.S. Treasury confirmed that it took part in a joint intervention in the foreign exchange market with Japan’s Ministry of Finance and Treasury Secretary Bessent called for increasing the size of the facility that was used to conduct the operation.
- Final July Manufacturing PMI readings from the region showed accelerating growth in most economies.
- Chinese press reported that convertible bond sales in China could exceed CNY100 bln this year.
In economic data:
- China’s July RatingDog Manufacturing PMI 50.9 (expected 51.9; last 51.7)
- Japan’s July Manufacturing PMI 54.5 (expected 54.7; last 54.8)
- South Korea’s July trade surplus $30.23 bln (expected surplus of $29.59 bln; last surplus of $36.09 bln). July Imports 26.5% yr/yr (expected 26.6%; last 30.0%) and Exports 62.8% yr/yr (expected 59.0%; last 70.7%). July Manufacturing PMI 53.1 (last 52.1)
- Australia’s July Manufacturing PMI 52.0 (expected 51.7; last 51.5). July MI Inflation Gauge 1.0% m/m (last -0.4%) and July ANZ Job Advertisements 2.0% m/m (last -0.2%)
- New Zealand’s June Building Consents -3.6% m/m (last -4.9%)
- India’s July Manufacturing PMI 53.5 (expected 53.9; last 54.2)
Major European indices trade firmly in the green while the U.K.’s FTSE (+0.2%) struggles to keep pace as AstraZeneca (AZN) weighs amid reports that the company held merger talks with Bristol-Myers Squibb (BMY). STOXX Europe 600: +0.4%, Germany’s DAX: +1.5%, U.K.’s FTSE 100: +0.2%, France’s CAC 40: +1.3%, Italy’s FTSE MIB: +0.9%, Spain’s IBEX 35: +0.8%.
In news:
- Falling energy prices and indications of U.S.-Iran deescalation have contributed to the overall strength in the region.
- Final July Manufacturing PMI readings from the region showed some deceleration in growth compared to flash estimates, though the eurozone’s reading (51.9) remained above 50.
In economic data:
- Eurozone’s July Manufacturing PMI 51.9 (expected 52.0; last 52.0)
- Germany’s June Retail Sales -1.1% m/m (expected -0.4%; last 1.2%); -0.2% yr/yr (last -2.8%). July Manufacturing PMI 52.2, as expected (last 52.2)
- K.’s July Manufacturing PMI 51.9 (expected 52.8; last 52.8)
- France’s July Manufacturing PMI 49.8 (expected 50.0; last 50.0)
- Italy’s Manufacturing PMI 51.3 (expected 52.5; last 52.2)
- Swiss July CPI -0.1% m/m, as expected (last 0.0%); 0.4% yr/yr (last 0.5%). July Manufacturing PMI 53.2 (expected 54.5; last 54.3)
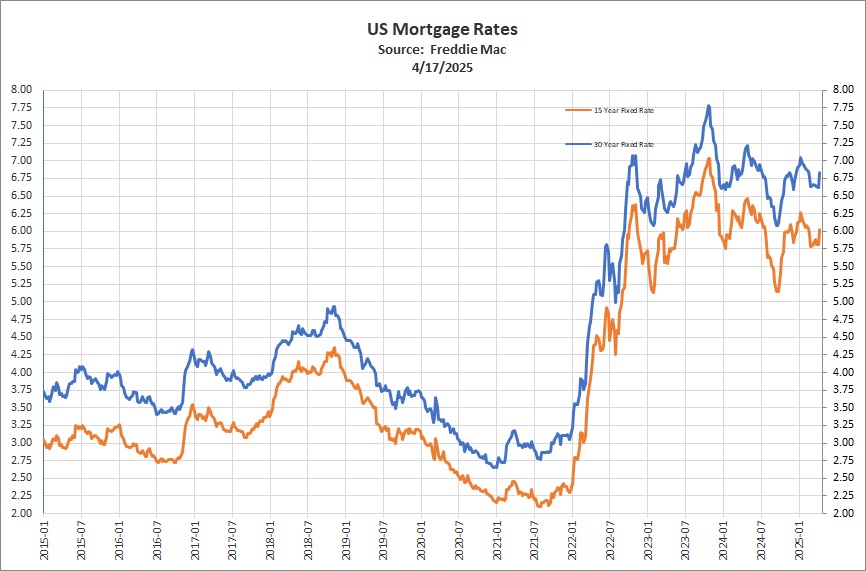
Mortgage Rates
“The 30-year fixed-rate mortgage averaged 6.66% this week,” said Sam Khater, Freddie Mac’s Chief Economist. “The housing market continues to benefit from more available inventory, providing prospective homebuyers with additional options and helping support buyer activity as mortgage rates fluctuate.”
The 30-year FRM averaged 6.66% as of July 30, 2026, up from last week when it averaged 6.58%. A year ago at this time, the 30-year FRM averaged 6.72%.
The 15-year FRM averaged 6.04%, up from last week when it averaged 5.96%. A year ago at this time, the 15-year FRM averaged 5.85%.
Selected Cryptocurrencies
| Symbol | Name | Price | 24h % | 7d % | Market Cap | Volume(24h) |
| BTC | Bitcoin | $62,399.19 | -1.05% | -4.26% | $1.25T | $17.89B |
| ETH | Ethereum | $1,836.68 | -0.90% | -6.38% | $221.65B | $6.25B |
| BNB | BNB | $584.77 | 0.54% | 2.04% | $77.87B | $918.88M |
| XRP | XRP | $1.06 | -1.46% | -3.82% | $66.49B | $844.41M |
| SOL | Solana | $72.28 | -1.01% | -5.73% | $42.01B | $1.03B |
| TRX | TRON | $0.33 | 0.16% | -1.21% | $31B | $366.08M |
| HYPE | Hyperliquid | $52.72 | 2.78% | -12.08% | $13.31B | $221.95M |
| DOGE | Dogecoin | $0.07 | -1.13% | -4.71% | $11.83B | $454.07M |
| LEO | UNUS SED LEO | $9.75 | -0.23% | 0.44% | $8.97B | $299.69K |
| ZEC | Zcash | $481.78 | 2.36% | -4.15% | $8.09B | $301.12M |
| ADA | Cardano | $0.19 | -1.36% | 13.28% | $6.81B | $533.67M |
| XMR | Monero | $360.06 | -0.28% | 2.27% | $6.76B | $68.53M |
| LINK | Chainlink | $8.16 | -1.39% | -6.96% | $6.1B | $177.77M |
| XLM | Stellar | $0.17 | -1.68% | -5.74% | $5.87B | $88.19M |
| CC | Canton | $0.11 | -1.02% | -6.93% | $4.51B | $8.42M |
| BCH | Bitcoin Cash | $209.72 | -1.07% | -4.35% | $4.2B | $56M |
Data as of 5:10 AM PDT, Monday, August 3, 2026. Source: https://coinmarketcap.com
If you know someone age 62 or over who is feeling stressed financially and considering a reverse mortgage please send them this excellent piece with general information about reverse mortgages at: https://beaconrwa.com/reversemortgageguidebrwa/
Sources: Bill Roller, BR Capital, Inc. dba Beacon Rock Wealth Advisors American Association for Individual Investors (AAII), Associated Press, Barclays Capital, Bloomberg, Briefing.com, Citigroup, Deutsche Bank, FactSet, Financial Times, Goldman Sachs, JPMorgan Asset Management, MarketfieldAsset Management, Morgan Stanley, MSCI, Morningstar, Northern Trust, Oppenheimer Funds, PIMCO, Standard & Poor’s, StockCharts.com, The Conference Board, Thomson Reuters, T. Rowe Price, U.S. Bureau of Economic Analysis, U.S. Federal Reserve, Wall Street Journal, The Washington Post. Index performance is shown as total return, which includes dividends, with the exception of MSCI-EM, which is quoted as price return/excluding dividends. Performance for the MSCI-EAFE and MSCI-EM indexes is quoted in U.S. Dollar investor terms.
The information above has been obtained from sources considered reliable, but no representation is made as to its completeness, accuracy or timeliness. All information and opinions expressed are subject to change without notice. Information provided in this report is not intended to be, and should not be construed as, investment, legal or tax advice; and does not constitute an offer, or a solicitation of any offer, to buy or sell any security, investment or other product BR Capital, Inc. dba Beacon Rock Wealth Advisors is a registered investment advisor.