
Your Weekly Update for Monday, September 14, 2026.
Beacon Rock Wealth Advisors is a dba of BR Capital, Inc. It is a financial planning and registered investment advisory firm in Camas, Washington. We are always available to answer your questions. Give us a call at (360) 735-1900 or send an email.
If you or someone you know is worried about retirement, send us an email or give us a call for a no-obligation Retirement and Social Security Analysis.
If this information is helpful to you, please forward this to a friend and ask them to subscribe at https://newsletters.beaconrwa.com/subscribe.
Have a great week!
Bill Roller
NMLS #107972
CHARTERED FINANCIAL ANALYST
CERTIFIED FINANCIAL PLANNERTM
CHARTERED MARKET TECHNICIAN
bill.roller@beaconrwa.com
Summary
Markets were DOWN last week. The Dow Jones Industrial Average was DOWN 1.57% to 52,573.29 while the S&P500 ended DOWN .80% to 7,656.98. The Nasdaq Composite FELL 0.66% to 26,333.04. The annual yield on the 30-year Treasury ROSE 10.8 basis point(s) to 5.354%.
Last Week
Closing Market Summary: Tech strength and oil relief fuel Friday rebound
The major averages snapped a four-session losing streak on Friday, ending the holiday-shortened week with a broad rebound as lower oil prices and renewed strength in technology stocks outweighed increased expectations for a rate hike next week. The S&P 500 (+0.9%), Nasdaq Composite (+1.0%), and DJIA (+1.0%) held sizable gains through the close, while the Russell 2000 (+0.5%) and S&P Mid Cap 400 (+0.8%) also finished higher. Despite the rebound, the major averages still ended firmly lower for the week.
A pullback in crude oil offered some relief from one of the market’s biggest headwinds of the past several sessions. WTI crude settled $2.31 lower (-2.3%) at $100.08 per barrel, trimming its advance for the week to roughly 10%. The retreat came amid reports that Gulf states will meet with Iran on Monday to discuss the Strait of Hormuz, providing some optimism for a potential de-escalation after crude surged above $102 per barrel on Thursday.
Perhaps more notable was the market’s ability to rally despite an August CPI report that further strengthened expectations for tighter monetary policy. Total CPI increased 0.4% month-over-month, as expected, while core CPI rose a slightly hotter-than-expected 0.3% (Briefing.com consensus: 0.2%). The CME FedWatch Tool now assigns an 86.5% probability to a 25-basis-point rate hike at Wednesday’s FOMC meeting, compared with 69.4% immediately before this morning’s report.
Technology and other growth stocks supplied much of Friday’s leadership. The communication services (+1.4%) and information technology (+1.1%) sectors were among the better performers as Alphabet (GOOG 335.45, +5.06, +1.53%) and Apple (AAPL 332.27, +5.70, +1.75%) moved higher, with the Vanguard Mega Cap Growth ETF advancing 0.9%.
Semiconductor stocks also bounced back from Thursday’s sharp decline, lifting the PHLX Semiconductor Index 1.8%. Oracle (ORCL 150.15, -2.79, -1.82%) provided an important read-through for the AI infrastructure trade despite failing to hold its own early advance. Shares initially jumped by double digits following the company’s quarterly report before giving back the gain, but 121% year-over-year cloud infrastructure revenue growth, more than $30 billion in new AI-cloud contracts, and maintained FY27 capital spending plans reinforced expectations for continued data center investment. That outlook fueled sizable gains in Dell (DELL 567.14, +60.52, +11.95%), Hewlett Packard Enterprise (HPE 62.08, +6.86, +12.42%), and other related names as investors anticipated sustained demand for servers, networking equipment, and storage.
The advance was not confined to the technology complex. The industrials (+1.1%) and consumer discretionary (+1.1%) sectors also finished among the outperformers, helping give the rebound a relatively broad foundation.
Defensive groups moved in the opposite direction, with the health care (-0.1%) and utilities (-0.3%) sectors finishing as the day’s laggards.
Friday’s rebound ultimately recovered a meaningful portion of the losses accumulated earlier in the week, but it was not enough to prevent a firmly lower weekly finish for the major averages. The session also showed that investors were willing to look through a less favorable rate outlook when some pressure from crude oil subsided and technology leadership reemerged. Attention now shifts squarely to Wednesday’s FOMC decision, where the market is assigning an 86.5% probability to a 25-basis-point rate hike.
U.S. Treasuries had a mostly lower finish to a rough week that saw yields on all notes and bonds hit fresh highs for the year amid firming expectations for a rate hike next week. The 2-year note yield settled up nine basis points to 4.64% (+26 basis points this week), and the 10-year note yield settled up three basis points to 4.98% (+20 basis points this week).
- Russell 2000: +17.0% YTD
- Nasdaq Composite: +13.3% YTD
- S&P Mid Cap 400: +12.4% YTD
- S&P 500: +11.9% YTD
- DJIA: +9.4% YTD
Reviewing today’s data:
- August CPI 0.4% (Briefing.com consensus 0.4%); Prior 0.1%, August Core CPI 0.3% (Briefing.com consensus 0.2%); Prior 0.2%. The key takeaway from the report is that it wasn’t good enough to put September rate-hike fears to rest.
- September Univ. of Michigan Consumer Sentiment – Prelim 47.8 (Briefing.com consensus 51.5); Prior 51.7. The key takeaway from the report is the dour outlook embedded in the index of consumer expectations, which was plagued by a worsening outlook for personal finances and business conditions.
- The U.S. Treasury reported a $166.8 bln deficit for August (Briefing.com consensus -$485.0 bln). The Treasury Budget data is not seasonally adjusted so the August deficit cannot be compared to the July deficit of $432.3 bln. The deficit a year ago was $344.8 bln. The key takeaway is that the August deficit looked much better on the surface, but the underlying fiscal picture remains largely unchanged. The August deficit was down 52% yr/yr, but calendar shifts and lower tariff-refund outlays explain much of the improvement, while the fiscal YTD deficit remains near a record $1.97 trln and interest costs are up 13% yr/yr.
This Week
S&P futures vs fair value: -39.00. Nasdaq futures vs fair value: -425.00.
Equity futures point to a lower opening this morning amid pronounced weakness in semiconductor stocks and another increase in crude oil prices. Stocks are coming off a losing holiday-shortened week, although strength across technology stocks on Friday helped the major averages snap a four-session losing streak and recover a portion of their earlier losses.
Chip stocks are facing particularly heavy pressure following weakness in overseas trading, as recent comments from several AI executives and developers calling for a slower pace of AI development on safety grounds have weighed on the group.
Oil prices are also moving higher, adding another headwind after last week’s sharp advance. The latest increase follows the shutdown of Saudi Arabia’s East-West pipeline, while a planned meeting between Gulf Cooperation Council members and Iran to discuss establishing a temporary shipping corridor through the Strait of Hormuz has been postponed.
There are no notable economic releases on this morning’s calendar, leaving attention focused on Wednesday’s FOMC decision. The CME FedWatch Tool currently assigns an 88.5% probability to a 25-basis-point rate hike.
In corporate news:
- Sam Altman told Fortune that an OpenAI IPO will not happen this year.
- Anthropic to list on the NASDAQ, according to Business Insider.
- Apollo (APO 19, -0.79, -0.6%) is looking to buy an orthopedics unit fromJohnson & Johnson (JNJ 268.21, +2.63, +1.0%), according to Bloomberg.
- NVIDIA (NVDA 10, -5.19, -2.4%) is looking to invest in Anthropic, according to Reuters.
Reviewing overnight developments:
Equity indices began the week on a mostly lower note, with regional chip stocks under pressure amid concerns about slowing demand for memory products. Japan’s Nikkei: -0.8%, Hong Kong’s Hang Seng: +0.5%, China’s Shanghai Composite: -0.1%, South Korea’s Kospi: -3.3%, Australia’s ASX All Ordinaries: UNCH.
In news:
- Japan’s chief cabinet secretary said JGB issuance will be controlled through the initial and extra budgets.
- Major South Korean chipmakers rejected a proposal to make upfront payments for five years of power delivery.
In economic data:
- China’s August New Loans CNY60.0 bln (expected CNY480.0 bln; last -CNY340.0 bln), August Outstanding Loan Growth 5.0% yr/yr (expected 5.1%; last 5.1%)
- Japan’s July Industrial Production -0.2% m/m (expected 0.1%; last 1.9%) and Capacity Utilization 0.5% m/m (last 4.1%)
- Hong Kong’s Q2 PPI 13.1% yr/yr (last 17.7%). Q2 Industrial Production 2.3% yr/yr (last 3.2%)
- New Zealand’s August Performance of Services Index 51.2 (last 50.6). July Visitor Arrivals 0.5% m/m
- India’s August WPI Inflation 9.92% yr/yr (expected 9.89%; last 9.78%) and August CPI 4.98% (expected 4.80%; last 4.44%)
Major European indices trade mostly lower, while the U.K. market outperforms with support from consumer and insurance shares. STOXX Europe 600: -0.2%, Germany’s DAX: -0.3%, U.K.’s FTSE 100: +0.7%, France’s CAC 40: -0.6%, Italy’s FTSE MIB: -1.3%, Spain’s IBEX 35: +1.2%.
In news:
- European Central Bank policymakers Kazaks, Kazimir, and Simkus left the door open to additional rate hikes.
- Insurers have shown relative strength amid upward pressure on bond yields.
In economic data: Swiss August PPI 0.7% m/m (expected 0.1%; last -0.1%); -0.7% yr/yr (last -2.1%)
Mortgage Rates
“The 30-year fixed-rate mortgage averaged 6.76% this week,” said Sam Khater, Freddie Mac’s Chief Economist. “Aspiring buyers should remember shopping around for the best mortgage rate and getting multiple quotes can potentially save them thousands.”
The 30-year FRM averaged 6.76% as of September 10, 2026, up from last week when it averaged 6.71%. A year ago at this time, the 30-year FRM averaged 6.35%.
The 15-year FRM averaged 6.09%, up from last week when it averaged 6.04%. A year ago at this time, the 15-year FRM averaged 5.50%.
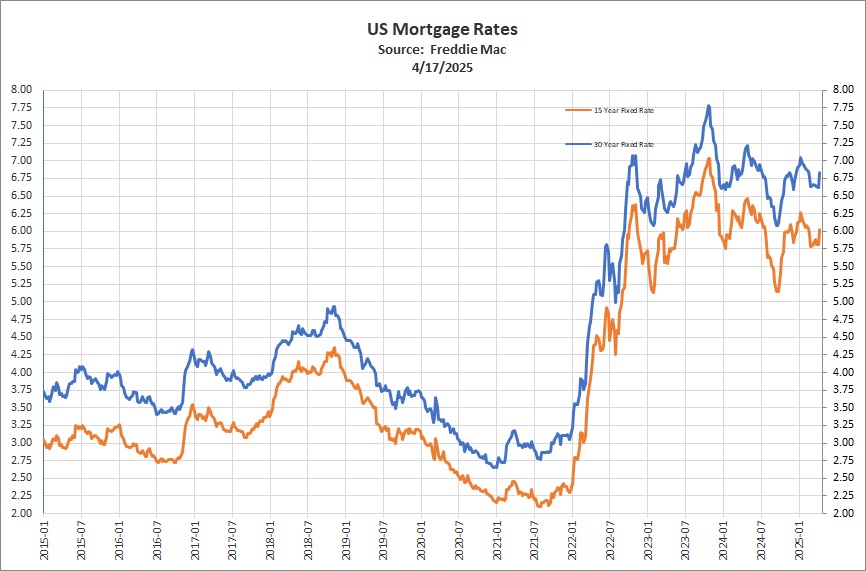
Freddie Mac’s Primary Mortgage Market Survey® is focused on conventional, conforming, fully amortizing home purchase loans for borrowers who put 20% down and have excellent credit. Average commitment rates should be reported along with average fees and points to reflect the total upfront cost of obtaining the mortgage. Borrowers may still pay closing costs which are not included in the survey.
Through our relationship with Mortgage Window, Inc. (NMLS 2485156) in Vancouver Washington we originate residential and reverse mortgages.
If you know someone age 62 or over who is feeling stressed financially and considering a reverse mortgage please send them this excellent piece with general information about reverse mortgages at: https://beaconrwa.com/reversemortgageguidebrwa/
Selected Cryptocurrencies
| Symbol | Name | Price | 24h % | 7d % | Market Cap | Volume(24h) |
| BTC | Bitcoin | $77,753.51 | 1.32% | 2.19% | $1.56T | $19.22B |
| ETH | Ethereum | $2,509.93 | 1.28% | 0.75% | $306.33B | $11.23B |
| BNB | BNB | $721.72 | 0.81% | 3.18% | $96.1B | $1.25B |
| XRP | XRP | $1.39 | 4.16% | 0.36% | $87.86B | $2.28B |
| SOL | Solana | $101.44 | 1.72% | 3.42% | $59.53B | $2.09B |
| TRX | TRON | $0.34 | 0.19% | 1.13% | $32.29B | $360.32M |
| HYPE | Hyperliquid | $80.12 | 3.35% | 8.91% | $20.16B | $650.84M |
| ZEC | Zcash | $1,132.54 | 3.73% | 5.13% | $19.1B | $1.18B |
| DOGE | Dogecoin | $0.08 | 0.81% | 6.45% | $14.43B | $593.49M |
| XMR | Monero | $511.56 | 4.66% | 4.19% | $9.61B | $105.87M |
| LINK | Chainlink | $11.39 | 0.99% | 13.65% | $8.52B | $255.48M |
| LEO | UNUS SED LEO | $8.96 | 0.90% | 2.35% | $8.24B | $147.36K |
| ADA | Cardano | $0.21 | 2.69% | 4.59% | $7.71B | $319.96M |
| XLM | Stellar | $0.19 | 6.61% | 1.15% | $6.61B | $162.91M |
| BCH | Bitcoin Cash | $223.39 | 0.08% | 13.05% | $4.48B | $169.15M |
| USD1 | World Liberty Financial USD | $1.00 | 0.01% | 0.04% | $4.3B | $891.76M |
Data as of 5:150 AM PDT, Monday, September 14, 2026. Source: https://coinmarketcap.com
Sources: Bill Roller, BR Capital, Inc. dba Beacon Rock Wealth Advisors American Association for Individual Investors (AAII), Associated Press, Barclays Capital, Bloomberg, Briefing.com, Citigroup, Deutsche Bank, FactSet, Financial Times, Goldman Sachs, JPMorgan Asset Management, MarketfieldAsset Management, Morgan Stanley, MSCI, Morningstar, Northern Trust, Oppenheimer Funds, PIMCO, Standard & Poor’s, StockCharts.com, The Conference Board, Thomson Reuters, T. Rowe Price, U.S. Bureau of Economic Analysis, U.S. Federal Reserve, Wall Street Journal, The Washington Post. Index performance is shown as total return, which includes dividends, with the exception of MSCI-EM, which is quoted as price return/excluding dividends. Performance for the MSCI-EAFE and MSCI-EM indexes is quoted in U.S. Dollar investor terms.
The information above has been obtained from sources considered reliable, but no representation is made as to its completeness, accuracy or timeliness. All information and opinions expressed are subject to change without notice. Information provided in this report is not intended to be, and should not be construed as, investment, legal or tax advice; and does not constitute an offer, or a solicitation of any offer, to buy or sell any security, investment or other product BR Capital, Inc. dba Beacon Rock Wealth Advisors is a registered investment advisor.