 Get the pdf version: Investor Insights & Outlook January 2014
History of Interest Rates
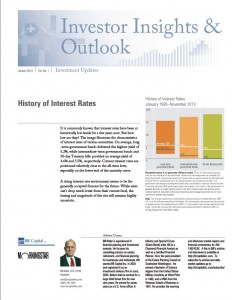
It is commonly known that interest rates have been at historically low levels for a few years now. But how low are they? The image illustrates the characteristics of interest rates of various maturities. On average, long-term government bonds delivered the highest yield of 5.2%, while intermediate-term government bonds and 30-day Treasury bills provided an average yield of 4.6% and 3.5%, respectively. Current interest rates are positioned relatively close to the all-time lows, especially on the lower end of the maturity curve.
A rising interest rate environment seems to be the generally accepted forecast for the future. While rates can’t drop much lower from their current level, the timing and magnitude of the rise still remains highly uncertain.
Economic Outlook for 2014
As the end of 2013 draws near, the U.S. economy appears very much like an ocean liner, finding it very difficult to change either speed or direction. As the table illustrates, overall GDP growth rates, employment growth and consumption have all been stuck in a very narrow range for the last three years.
Morningstar economists expect little change in the overall GDP growth rate for 2014, although the composition of that growth is likely to be somewhat different. Inventories should be a much smaller contributor to growth, net exports are likely to be a larger subtraction from GDP as imports grow, and government spending should be a much smaller negative in 2014.
Consumption, housing and business investments (excluding inventories) are likely to change little from their 2013 growth rates. Other forecasts may be more bullish on overall GDP growth, but Morningstar economists suspect growth rates in autos will decelerate, existing home sales will likely be flat, and government spending will still be a drag, albeit smaller than the rather large subtraction in 2013.
With little change in the 2% GDP growth rate, employment growth may not change that much, either. Slow growth, a wide output gap (a fancy capacity utilization measure) and a bumper farm crop should all keep inflation in check in 2014, though medical costs may rise faster than in 2013, bringing up the overall rate of inflation. With the Fed now officially tapering bond purchases, 10-year Treasury bond rates should move up to reflect the inflation rate plus a spread. Auto sales should continue to do well in 2014 with continued employment growth, new models, and an aging fleet. Unfortunately, auto sales are now approaching previous highs and the law of large numbers is beginning to set in, with year-over- year growth rates likely to slow. An acceleration in housing starts may still occur, as it has taken home builders some time to gear up for increased demand (zoning, land acquisition, etc.). However, existing homes will be hard pressed to grow much with higher rates, more competition from new homes, tight inventories, and lower affordability. Probably the biggest news in the fourth quarter was that the Fed would begin tapering its large $85 billion bond purchase program. This program was a truly extraordinary measure; never before has the Fed reacted so boldly and so beyond its sphere of short- term interest rates. Given extraordinarily tight fiscal measures and a slow-growth economy, the program was both helpful and necessary. With the economy at least a little better and an easing of the fiscal tensions, however, it was probably time for it to end. Markets had already anticipated the tapering last spring, and interest rates had previously made their move up. Further rate increases are possible, but the worst may be behind us.
Monthly Market Commentary
Recent economic data has not been uplifting, with poor auto sales, a subpar retail holiday season, and a weak employment report. Even home-price growth has been showing signs of slowing down. Only the trade report data was unequivocally good, though perhaps a little too good to be sustained. The Federal Reserve’s Open Market minutes expressed a lot of concern about the bond-buying program, raising the question whether we might end up stuck with a modestly weaker economy and a less generous Fed all at the same time—not a good prospect.
Employment: Year-over-year employment data paints a picture of continued slow employment and economic growth. On average, growth has been consistent, with 183,000 jobs added per month in 2012 and a very similar 182,000 jobs per month in 2013. Morningstar economists forecast growth of about 190,000 monthly jobs in 2014. Total employment growth (government and private) is just 1.6% versus 2.1% for the private sector by itself. That makes sense given that the government is still shedding jobs and that the government (at all levels) still accounts for about 16% of all jobs. That being said, the employment report was riddled with many big swings and inconsistencies. The data is likely to be revised upward, or perhaps bigger gains are in store for the months ahead.
Retail sales: Preliminary data suggests a weak holiday season and poor consumer spending patterns. Poor weather conditions, a shortened holiday season, and a reduced food stamps program all put a damper on results at brick-and-mortar stores, although Internet retailers probably did significantly better, despite some last-minute delivery snags.
Auto sales: The auto data was particularly troubling, with sales managing to hit only 15.4 million units in December, a sharp decrease from November’s recovery high of 16.3 million units. Averaging the two monthly figures is probably a better representation of reality, as Black Friday sales, bad weather, and a compressed holiday sales period hurt December sales.
Housing: Pending CoreLogic data suggests that home prices were down about 0.1% in December, and the year-over-year growth rate slipped to 11.5%. Hardly a disaster, but the data suggests an early-2014 end to the double-digit increases in home prices. Given slipping affordability and higher mortgage rates, this may not be an entirely bad thing, but those expecting a continued boom might be disappointed.
Pending home sales had a huge runup in the middle of the year, as buyers raced frantically to beat higher mortgage rates and temporarily distorted the market. The raw index moved from 95 in January 2012 all the way up to 111 in June 2013. The index then declined for five-straight months, bottoming at 101.5 in October. The November data showed a statistically insignificant increase to 101.7 (at least it didn’t fall again). Unfortunately, the three-month-averaged year- over-year data is still in decline, and a snowy December won’t help the last month of the year.
Overall, recent data suggests a stronger economy, but not a sharply stronger one. Autos, housing, and inventories are likely to contribute less to GDP growth in 2014 than in 2013. Still, Morningstar economists estimate that inflation-adjusted GDP growth at the high end of the 2.0%–2.5% range is entirely possible, and the likelihood of a big slump seems remote.
Looking forward, the data might suggest a temporary weakening in the spring (higher heating costs, new home-lending limits, difficult comparisons, and other issues related to cold weather). Reduced unemployment benefit periods and food stamp reductions in place since November (unless reversed by Congress) are likely to keep a lid on things, too. But as the wintry weather lifts, the economy could see a decent bounce, unlike the past two years when warm weather helped sales in the winter months, but normal spring rebounds were muted.
Year-End Portfolio Review: Rebalancing
Finding the right frequency for rebalancing is a personal decision that rests on a number of factors. Here’s an overview of what to bear in mind.
Tax Status of Investments: Rebalancing involves peeling back on winners, which in turn could result in taxable capital gains if the sales occur within taxable accounts. Investors whose assets are mostly in taxable accounts may want to err on the side of less-frequent rebalancing. On the flip side, the tax costs of rebalancing aren’t a concern for investors who hold assets mostly in tax-sheltered accounts.
Other Costs of Trading: Commissions, for example. Investors who use a commission-based broker or buy or sell by themselves on a commission-based platform may consider rebalancing less frequently. Those who do not use a broker can view transaction costs as less of an impediment to rebalancing.
Time Commitment: A more frequent monitoring and rebalancing approach requires a greater amount of time than a laissez-faire tack. For example, retirees who have the time to commit to more frequent oversight (and won’t incur tax and transaction costs to rebalance) can take a more hands-on approach. For busy investors, it’s fine to check up annually.
Time Horizon/Risk Tolerance: The key benefit of rebalancing is in the realm of risk management, not potential return enhancement. By extension, investors with shorter time horizons and more limited risk tolerance may want to tightly police their asset allocations versus their targets. Longer-term investors, meanwhile, can employ a more hands-off approach.
This information is provided for informational purposes only and should not be construed as tax advice. Consult your tax advisor for advice regarding your personal situation.
©2013 Morningstar, Inc. All Rights Reserved. The information contained herein (1) is intended solely for informational purposes; (2) is proprietary to Morningstar and/or the content providers; (3) is not warranted to be accurate, complete, or timely; and (4) does not constitute investment advice of any kind. Neither Morningstar nor the content providers are responsible for any damages or losses arising from any use of this information. Past performance is no guarantee of future results. “Morningstar” and the Morningstar logo are registered trademarks of Morningstar, Inc. Morningstar Market Commentary originally published by Robert Johnson, CFA, Director of Economic Analysis with Morningstar and has been modified for Morningstar Newsletter Builder.