 Get the pdf version: Investor Insights & Outlook February 2014
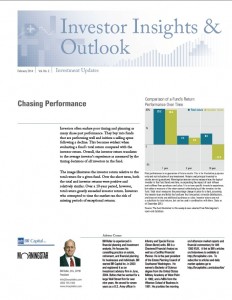
Chasing Performance
Investors often endure poor timing and planning as many chase past performance. They buy into funds that are performing well and initiate a selling spree following a decline. This becomes evident when evaluating a fund’s total return compared with the investor return. Overall, the investor return translates to the average investor’s experience as measured by the timing decisions of all investors in the fund.
The image illustrates the investor return relative to the total return for a given fund. Over the short term, both the total and investor returns were positive and relatively similar. Over a 10-year period, however, total return greatly exceeded investor return. Investors who attempted to time the market ran the risk of missing periods of exceptional returns.
Fund Flows and Asset Class Performance
Over the last 20 years, markets have experienced many shocks and recessions, including the Asian currency crisis, the Russian debt default, the dot-com crash of the early 2000s, and the recent global financial crisis. When these events occur, investors frequently attempt to reduce (or increase) investments to certain asset classes in order to lower exposure to (or take advantage of) the situation.
In 2008, the global financial crisis caused U.S. large stocks and international stocks to perform poorly, with losses of 37.0% and 43.1%, respectively, while bonds rose by 25.9%. In the wake of the recession, bonds performed very well in 2011, returning 28.2% as concerns about a possible double-dip recession grew. In the same year, international stocks fell 11.7%, most likely the result of events such as the sovereign debt crisis that rippled throughout the global landscape.
For all asset classes, demand and supply determine the market price of an investment. Understanding this trend may help investors ascertain how an asset class fits into their portfolio. Starting in 2007, annual net asset fund flows into U.S. stock funds became negative and stayed that way through 2012. Flows into bond funds, on the contrary, reached a peak in 2009 and remained high in 2010, 2011, and 2012 as investors flocked to relatively safer assets. As bond returns grew unusually high over the last few years, flows into bond funds may have increased as investors chased bond performance. Interestingly, outflows from U.S. stock funds continued despite U.S. large stocks showing positive returns since 2009. Was chasing bond performance the right thing for investors to do, or did investors just miss out on the returns of U.S. large stocks over the last couple of years?
About the data
U.S. Large Stocks—S&P 500® Index, which is an unmanaged group of securities and considered to be representative of the U.S. stock market in general. International Stocks—Morgan Stanley Capital International (MSCI) World ex-U.S. Index. Bonds—20-year U.S. government bond. Annual Net Asset Fund Flows: U.S.-domiciled open-end fund flows from Morningstar. Start date of 1994 constrained by data availability. U.S. stock: funds that primarily invest in U.S. stocks; International stock: funds that invest in specific regions or a diversified mix of international stocks with 40% or more in foreign stocks; Bond: taxable bond funds (government, corporate, international, emerging markets, high yield, multisector) that invest primarily in fixed-income securities of varying maturities.
Monthly Market Commentary
Even though the U.S. market lost 3.5% in January, investors still seemed hopeful about continued low interest rates (now more likely, given soft economic activity) and about the potential for slower Fed tapering of bond purchases. (However, interest rates continue to decline even as the Fed tapers.)
Speaking of soft economic activity, recent auto sales, manufacturing data, trade data, construction spending, and employment all fell well below plan. About the only good news was that the U.S. government’s fiscal situation continues to improve, with forecasts of declining budget deficits reiterated again this week. Bad weather in the Midwest and Northeast isn’t helping the overall economic picture, but it probably isn’t the entire reason for the poor data reports that now stretch across several months and many data points.
Employment: Total nonfarm payroll employment rose by 113,000 in January, and the unemployment rate was little changed at 6.6%. Sectors that saw improvement included construction, manufacturing, wholesale trade, and mining. Health care and education added almost no jobs for the second month in a row, after being the bulwark of job growth for a large part of the economic recovery. Cost controls and fear of Affordable Care Act provisions seem to have really kept a lid on health-care hiring, and unless health-care employment turns the corner, it will be a major impediment to employment growth in 2014.
GDP: The first run of the GDP report for a given quarter comes out one month after the end of the quarter and is revised twice based on new or revised data. Much of the actual data released the first week of February for inventories, net exports, and construction data contradicted previous estimates. When all these potential revisions are added together, Morningstar economists caution they could take as much as 0.9% off of the original GDP estimate, meaning the economy potentially grew a slower 2.3% in the fourth quarter of 2013, instead of the 3.2% originally reported.
Trade: The headline trade deficit widened markedly in December to $38.7 billion, up from $34.6 billion in November, which was unusually good. However, it wasn’t far off of the average for all of 2013 of $39.3 billion. (A smaller trade deficit is positive for the economy.) That full-year average represents a huge improvement from $46.4 billion in 2012 and $44.6 billion in 2011. During an economic recovery, the trade deficit almost always widens as exports and imports usually grow at relatively similar rates, and imports are far larger than exports. Decreased oil imports and oil-related exports are clearly making a difference. However, it’s not just about oil; imports across the board have increased, as they often do in a recovery. Still, exports of non-oil-related goods have done even better.
Consumer Spending: Over the third quarter of 2013, income growth (as measured by real disposable income) exceeded consumption growth in each individual month of the quarter. That situation exactly reversed itself in the fourth quarter when consumption growth far exceeded income growth in every month.
Housing: Pending home sales continued to fall in December, hitting their lowest level since 2011. Although higher rates and stronger home prices have plagued this data point since May, this month was likely affected by poor weather conditions. But even averaging the data and looking year over year, the trend in pending home sales has been abysmal. Pending home sales are important because they are a leading indicator of closed existing-home sales. It is those closed deals that generate remodeling, moving, furniture buying, and mortgage activity that is helpful to the economy. Judging by the gap between the pending sales index and the existing-home sales index, existing-home sales are likely to fall even more in the early months of 2014.
Short-Term Focus: Coping with Near-Term Fluctuations
Instant access to real-time quotes and media reports can make it difficult for investors with a long-term investment horizon to stay focused on their goals. In reality, these daily market movements may not be as extreme as they seem. As investors look longer term, their perception often changes. Short-term market fluctuations can be quite volatile, and the probability of realizing a loss within any given day is high. However, the likelihood of realizing a loss has historically decreased over longer holding periods. The image illustrates that while the probability of losing money on a daily basis over the past 20 years was 46%, the probability dropped dramatically when analyzing an annual time period—20%. Periodic review of an investment portfolio is necessary, but investors shouldn’t let short-term swings affect their view of the future.
©2013 Morningstar, Inc. All Rights Reserved. The information contained herein (1) is intended solely for informational purposes; (2) is proprietary to Morningstar and/or the content providers; (3) is not warranted to be accurate, complete, or timely; and (4) does not constitute investment advice of any kind. Neither Morningstar nor the content providers are responsible for any damages or losses arising from any use of this information. Past performance is no guarantee of future results. “Morningstar” and the Morningstar logo are registered trademarks of Morningstar, Inc. Morningstar Market Commentary originally published by Robert Johnson, CFA, Director of Economic Analysis with Morningstar and has been modified for Morningstar Newsletter Builder.