 Get the pdf version: Investor Insights & Outlook December 2013
The Importance of Staying Invested
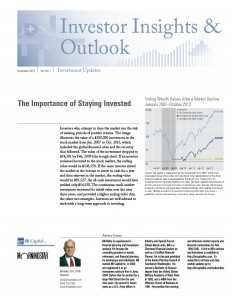
Investors who attempt to time the market run the risk of missing periods of positive returns. The image illustrates the value of a $100,000 investment in the stock market from Jan. 2007 to Oct. 2013, which included the global financial crisis and the recovery that followed. The value of the investment dropped to $54,381 by Feb. 2009 (the trough date). If an investor remained invested in the stock market, the ending value would be $143,550. If the same investor exited the market at the bottom to invest in cash for a year and then reinvest in the market, the ending value would be $93,527. An all-cash investment would have yielded only $54,558. The continuous stock-market investment recovered its initial value over the next three years, and provided a higher ending value than the other two strategies. Investors are well advised to stick with a long-term approach to investing.
Monthly Market Commentary
The onslaught of positive economic news during the past couple of weeks has been relentless. Even fears of an earlier Federal Reserve reduction in bond purchases couldn’t dampen spirits on Dec. 6 when a positive jobs report had everyone cheering. This and other recent numbers put a lot of fears to rest with accelerating purchasing manager data, robust auto sales, improving consumption data, better job growth, and more new- home sales. The economy appears to have gotten back what it lost this summer, and maybe there is even a slight acceleration. The data still doesn’t show anything like a boom, but life is better.
GDP: GDP growth for the September quarter was revised up to 3.6% (the third-best quarter of this 17- quarter recovery) from 2.8%. It was also above the 3.1% post-World War II average and the consensus estimate of 3.2% growth.
However, almost all of the upward revision was due to a higher estimate of inventories. GDP counts production whether it is sold or whether it is still sitting on the shelves. The 0.8% increase in the estimated GDP contribution from inventory growth, combined with the original estimate of a 0.9% contribution, means that inventories added 1.7% to the GDP estimate, or almost half of the 3.6% total for the third quarter. Unless consumption, which grew at lethargic 1.4% rate, accelerates quickly, firms are likely going to need to cut production in the fourth quarter to bring inventories and sales into better alignment.
Speaking of consumption, these figures were revised downward in this week’s report, which is not good news. Consumption contributed just 1.0% to GDP growth, down from 1.5% in the first quarter and 1.2% in the second quarter, hardly an encouraging sign. The services part of the economy was particularly disappointing, showing no growth in the third quarter.
Employment: The most recent employment report was consistent with slow and steady growth. 203,000 overall jobs were added in November, ahead of expectations of 180,000 jobs and the 200,000 total jobs added the previous month. The number was also surprisingly consistent with the average growth of 193,000 jobs added per month over the past 12 months. The report ranks number six out of the last 13 months and was below last November’s 256,000 and February’s 319,000.
Housing: New-home sales jumped a seemingly strong 25% in October compared with September. However, that was because sales in September were down sharply, and August sales figures were revised sharply downward. Sales of 444,000 homes for October were above the nine-month average of 420,000, but not by a lot. Sales in September were an embarrassing 354,000, the lowest level since early 2012. Overall, however, the seemingly great October data is a mirage, and it looks like the market for new homes isn’t improving all that much. January sales of 458,000 topped the October report, as did several other reports this year. Year-over -year averaged data paints a picture of a housing market that is rapidly losing momentum.
Consumer spending: After months of sluggishness, consumer spending increased 0.3% in October. Incomes showed a small decline after months of massive increases. On a year-over-year basis, the data provides a clearer picture, with incomes improving at better pace than consumption after months of lagging behind (largely because of the payroll tax increase and the income tax increase early in the year).
Inventories: A number of industries, including autos, apparel retailers, homebuilders, and even restaurants stepped up inventories and hiring even if short-term demand didn’t fully justify it based on current data. High inventories can indicate a business’ confidence and its forecast of better growth in the near future, but they can also be a bad thing if they get too high and anticipated consumer demand fails to materialize.
Dispelling Myths about 529 Plans
Myth 1: You have to contribute to a 529 in your home state. That statement is false with regard to 529 college-savings plans, in which money is invested in a portfolio of securities on behalf of a beneficiary. Any U.S. resident can contribute to a 529 college-savings plan in any state. Contributing to a plan offered by your home state might offer an added bonus in the form of a state income tax deduction, but that shouldn’t be your sole consideration. If your state’s plan is poor (with high fees and poor investment options, for example) looking at plans outside your state might be worth forgoing the tax break.
Myth 2: You have to send your child to a school in the state where his 529 plan is offered. Also false. A 529 college-savings plan is fully portable, meaning that assets can be used for college expenses in any state and at some institutions abroad regardless of which state’s plan holds the account.
Myth 3: You can only get a tax deduction if you contribute to your state’s plan. Usually true, but not always. In fact, residents of Arizona, Kansas, Maine, Missouri, and Pennsylvania get a state income tax break on 529 contributions made to any state’s plan. Elsewhere the benefit is restricted to contributions to in-state plans, with deduction limits varying from state to state and some states offering tax credits.
Myth 4: If you save in a 529 account for your child, it will hurt his financial aid prospects. Possibly, but not as much as you might think. Yes, financial aid calculations generally do take into consideration 529 assets, but money in a 529 account owned by the parents or a dependent student counts far less than assets owned by the student outside a 529. In fact, non-529 student-owned assets carry more than 3 times more weight in financial aid calculations than do assets held in the parents’ names. So no, 529 accounts aren’t completely impact-free when it comes to financial aid, but the impact is relatively minor.
Myth 5: If your child doesn’t go to college, you’ll lose the money. Unused 529 money does not have to go to waste, or to the tax collector. It can be used to help pay another family member’s college costs simply by changing beneficiaries or transferring funds to the family member’s existing 529 account. And the list of potential recipients is rather long, including siblings, first cousins, parents, grandchildren, aunts and uncles, and even in-laws. If you do decide to cash out the plan, you’ll have to pay federal and state income taxes on earnings, plus a 10% penalty (waived if the beneficiary dies, becomes disabled, or gets a scholarship).
Myth 6: All 529 plans are the same. This is a potentially costly mistake some investors make. Like many investment products, 529 plans may look similar from the outside, but once you get under the hood you’ll find major differences that determine how effective they can be at helping you meet your college- savings goals. Fees, fund offerings, glide path (the rate at which the asset allocation switches from equities to fixed-income in age-based portfolios), and even ease of use vary from plan to plan. Fees, in particular, can have a corrosive effect on 529 assets, and can vary not only from state to state but also within the same plan.
529 plans are tax-deferred college savings vehicles. Any unqualified distribution of earnings will be subject to ordinary income tax and subject to a 10% federal penalty tax. Tax law is ever-changing and can be quite complex. It is highly recommended that you consult with a financial or tax professional with any tax-related questions or concerns. An investor should consider the
investment objectives, risks, and charges and expenses associated with municipal fund securities before investing. More information about municipal fund securities is available in the issuer’s official statement, and the official statement should be read carefully before investing.
The End of the Recession
In September 2010, the National Bureau of Economic Research announced the long-awaited news: an end date for the recession that had begun in December 2007. The NBER determined the official end date as June 2009, quieting down (if not completely silencing) double-dip fears. NBER defines a recession as a significant decline in economic activity spread across the economy, lasting more than a few months, normally visible in real GDP, real income, employment, industrial production, and wholesale- retail sales. Looking back at the performance of the main asset classes during the recession and in the years following the official end date, gold was the best overall performer, and long-term government bonds offered consistent positive returns. Out of the investments with the worst performance during the recession, REITs posted the most impressive return in the four post-recession years.
©2013 Morningstar, Inc. All Rights Reserved. The information contained herein (1) is intended solely for informational purposes; (2) is proprietary to Morningstar and/or the content providers; (3) is not warranted to be accurate, complete, or timely; and (4) does not constitute investment advice of any kind. Neither Morningstar nor the content providers are responsible for any damages or losses arising from any use of this information. Past performance is no guarantee of future results. “Morningstar” and the Morningstar logo are registered trademarks of Morningstar, Inc. Morningstar Market Commentary originally published by Robert Johnson, CFA, Director of Economic Analysis with Morningstar and has been modified for Morningstar Newsletter Builder.