Your Weekly Update for Monday, July 27, 2020.
Beacon Rock Wealth Advisors is a financial planning and registered investment advisory firm in Camas, Washington. We are always available to answer your finance questions. Give us a call at (800) 562-7096 or send an email toinfo@beaconrwa.com.
With this volatility in the markets you may have questions about your portfolio. We are both available by Zoom or Skype to answer your questions. Call or email and we will get it set up.
Please support your local small businesses. Go get some take-out from your favorite restaurant!
If you or someone you know is worried about retirement, send us and email or give us a call for a no-obligation Retirement and Social Security Analysis.
If you find this information useful, please forward this newsletter to a friend and ask them to subscribe at https://newsletters.beaconrwa.com/subscribe.
Have a great week!
Mike Elerath
CERTIFIED FINANCIAL PLANNERTM
CERTIFIED IN LONG-TERM CARE
NATIONAL SOCIAL SECURITY ADVISOR
Bill Roller
NMLS #107972
CHARTERED FINANCIAL ANALYST
CERTIFIED FINANCIAL PLANNERTM
CHARTERED MARKET TECHNICIAN
For more information about Beacon Rock Wealth Advisors, check out our brochure here: https://beaconrwa.com/wp-content/uploads/2020/04/BeaconRockBrochure.pdf
Summary
Markets fell last week. The Dow Jones Industrial Average dropped 0.76% to 26,469.89, while the S&P500 fell 0.28% to 3,215.63. The Nasdaq Composite fell 1.33% to 10,363.18. The annual yield on the 30-year Treasury fell 9 basis point to 1.239%.
Economic data for the week included stronger results for housing prices and sales activity, some of which was due to continued tight inventories. The index of leading economic indicators also showed signs of improvement. However, jobless claims rose, which disappointed relative to expectations.
U.S. equity markets lost ground last week, while developed foreign markets offered mixed results, and emerging markets rallied a bit. Bonds also fared well as interest rates declined further. Commodities rose on the back of energy and precious metals.
Economic Notes
(-/0) The FHFA house price index for May fell by -0.3%, which fell below expectations calling for a 0.3% increase. Nationally, prices fell in all but two of the nine regions, with the New England and Pacific states each showing declines of -1% for the month. Year-over-year, the FHFA index decelerated by over a half-percent to a still-elevated 4.9% rate.
(+) Existing home sales reversed course in June, rising by 20.7% to a seasonally-adjusted annualized rate of 4.72 mil. units. However, this fell short of the 21.4% growth bounce expected, and the year-over-year rate of change is still a negative -11%. For June, condos/co-ops rose by nearly 30%, while single-family units gained 20%. Sales increased in all four national regions, led by the West and South, upwards of 25% or more, while the Northeast rose just under 5%. Sales activity growth was expected, due to a broad reopening of economic activity. At the same time, inventory remains historically tight, falling to 24 days in June, and early two-thirds of homes selling within a month.
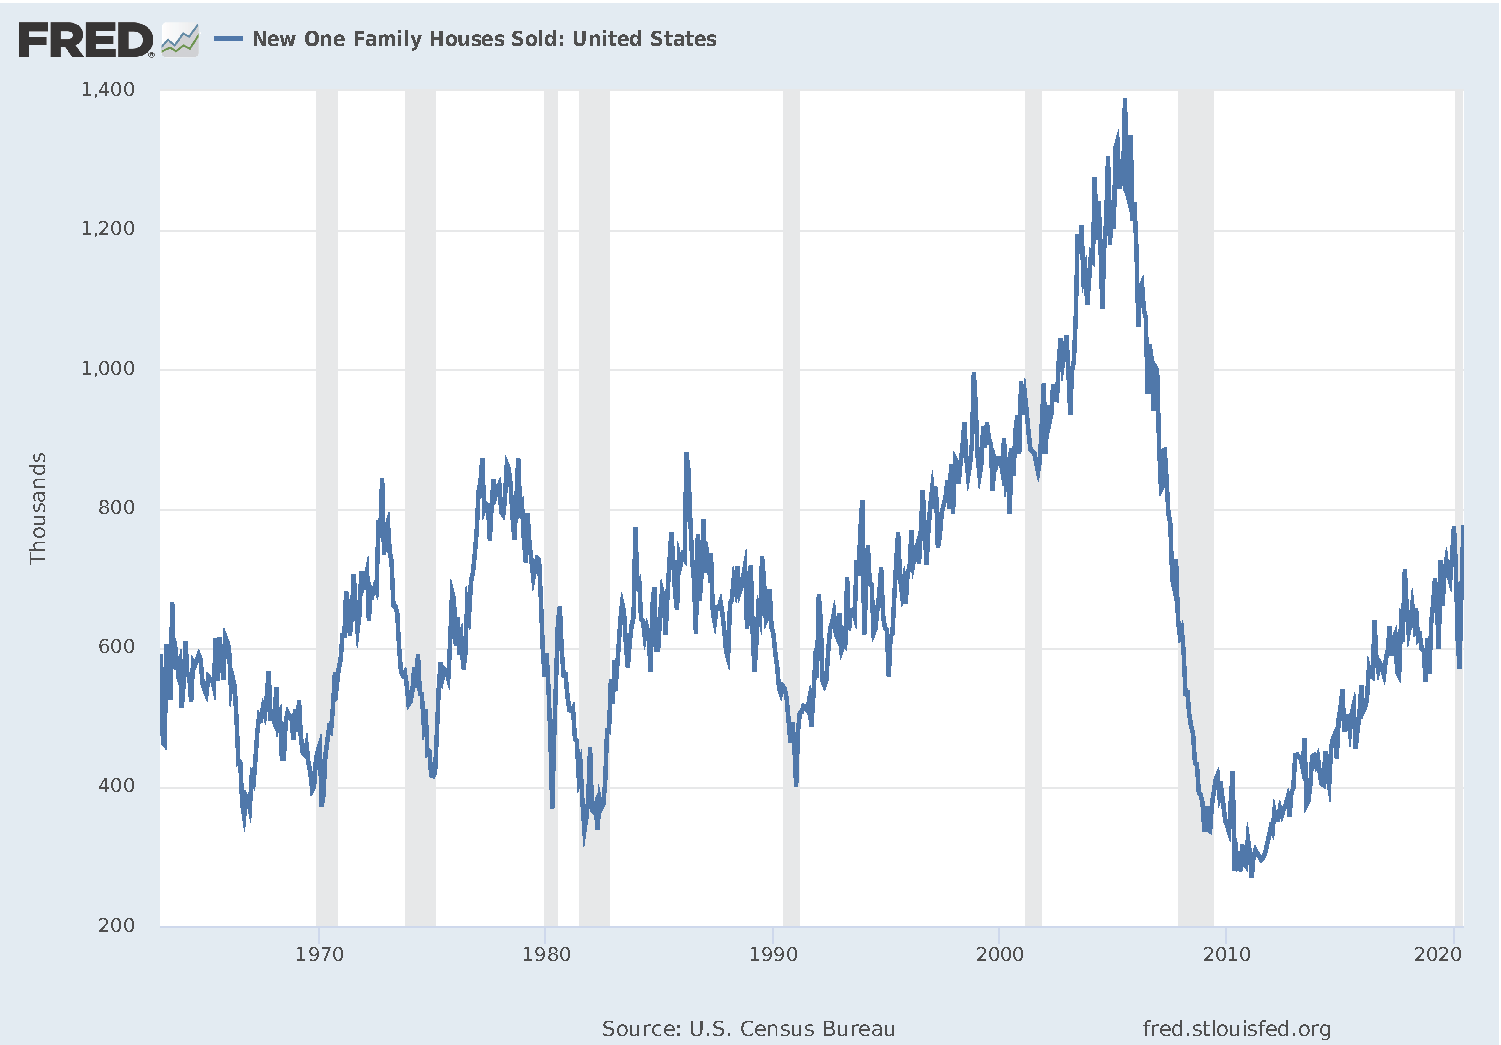
(+) New home sales in June rose by 13.8% to a seasonally-adjusted level of 776k, which surpassed expectations calling for 700k, including mixed revisions for prior months. Regionally, the West, South, and Northeast experienced gains of similar strength, while the Midwest lagged slightly. While improved from troughs earlier this year, homebuilding remains at very low levels. The Covid has continued to put a damper on logistics, such manufacturing and transportation of materials, as well as work crew operations. This is in addition to the multi-year difficulty in finding skilled workers. Most critically, current production levels are far below the estimated 1.5 mil. annual need for new homes—this has led to tight inventories for existing and new homes, as well as higher prices. Historical lows in mortgage rates (sub-3%) have certainly helped buyer sentiment as well, although servicing costs remain consistent, which has kept the historical spread vs. the 10-year treasury wider than normal. At the same time, banks are far pickier insofar as lending standards are concerned compared to 12 years ago.
(+) The Conference Board’s Index of Leading Economic Indicators increase 2.0% in June, similar to the coincident index, which gained 2.5%. On the other hand, the index of lagging indicators fell -2.5%. For the month, the positive results in lower jobless claims, higher manufacturing hours, and higher stock prices, led to the increase. For the first half of 2020, the leading index fell by an annualized -16.2% annual rate, which was far below the -0.4% annualized rate from the latter half of 2019—no surprise considering the current pandemic situation. Per the chart below, in expected fashion, these metrics crashed in Q1, but some signs of life are surfacing in recent months along with reopenings and some improved, yet mixed, optimism generally.

(-) Initial jobless claims for the Jul. 18 ending week rose for the first time since March, by 109k to 1.416 mil., which exceeded the median estimate calling for 1.300 mil. However, to confuse this further, when removing the seasonal adjustment, the increase turned into a decrease of similar magnitude. Continuing claims for the Jul. 11 week, on the other hand, fell by -1.107 mil. to 16.197 mil., which was below the 17.100 mil. median forecast expected. Initial claims fell sharply in FL and TX, recently hard-hit states, but rose sharply in NY, which has been recovering.
Market Notes
| Period ending 7/24/2020 | 1 Week (%) | YTD (%) |
| DJIA | -0.74 | -6.00 |
| S&P 500 | -0.27 | 0.62 |
| Russell 2000 | -0.38 | -11.36 |
| MSCI-EAFE | 0.41 | -7.31 |
| MSCI-EM | 0.51 | -4.86 |
| BBgBarc U.S. Aggregate | 0.41 | 7.40 |
| U.S. Treasury Yields | 3 Mo. | 2 Yr. | 5 Yr. | 10 Yr. | 30 Yr. |
| 12/31/2019 | 1.55 | 1.58 | 1.69 | 1.92 | 2.39 |
| 7/17/2020 | 0.11 | 0.14 | 0.29 | 0.64 | 1.33 |
| 7/24/2020 | 0.11 | 0.14 | 0.27 | 0.59 | 1.23 |
U.S. stocks were affected by a mixed bag of news, beginning strong but ending up lower on net. The more cyclical sectors of energy, financials, and consumer discretionary outperformed, with gains over a percent. On the other hand, recent market leaders technology and communications services fell by over a percent each. Declines in Apple and Intel, among other chipmakers, brought down the former. Just over a quarter of firms in the S&P have reported earnings for Q2, with a year-over-year drop of nearly -45% noted thus far. Differentiation is certainly less relevant this quarter compared to many, due to the extreme magnitude of weakness.
News early in the week continued to be positive, on the heels of the prior week’s progress by multiple entities in creating seemingly effective Covid vaccines. Now, the Phase 3 work will take a few months, in addition to the mixed news as to whether a vaccine would be a single-dose (preferred, easier to administer broadly) or two-dose (historically more effective, yet much more difficult to administer, especially in developing nations).
On the negative side, U.S.-China tensions are again escalating. Accusations of hacking/spying have intensified, focused on the Chinese consulate building in Houston—which the U.S. has ordered China to vacate. China retaliated in kind by ordering the U.S. departure from an embassy in Chengdu. While hopes for additional Congressional fiscal stimulus has been in the works behind the scenes, a final package does not appear ready for the next few weeks. Disagreements over unemployment bonus payments (like the $600/week set to expire at the end of July) are at the core of the debate. This amount, perceived to be high by some, has been seen as eroding incentives to work (if work is available). However, it appears increasingly likely that single payments (possibly $1,200) might be mailed again in August, per the Treasury Department.
Foreign stocks were mixed, with flattish results in Europe offsetting declines in the U.K. and Japan. Signs of economic improvement, such as expansionary PMI in the euro group and retail sales in the U.K., helped boost sentiment. There also appeared to be some progress on Brexit negotiations, which have been on hold during the pandemic. Emerging markets saw gains broadly, with weakness in China outweighed by gains of several percent each in Brazil, Russia, India, and Mexico.
The idea of a European recovery fund (€ 750 bil.) appears to be close to a done deal—this would essentially act as a bailout bucket with funds from wealthier countries (generally Northern) used to subsidize the less fortunate countries (generally Southern, mostly Italy). The concept underlying such an agreement is that a strong Europe is the ultimate goal—with an aftermath of peripheral nations falling out of union being much more damaging long-term than providing assistance in the meantime. Now, logistics and jurisdictional law remain the hurdles. The four European countries dubbed the ‘Frugal Four’ (Austria, Denmark, Netherlands, and Sweden) prefer loans to outright grants, which has caused the stimulus mix to morph into roughly half-and-half.
U.S. bonds fared positively last week, with interest rates continuing to tick lower, upon equity market declines and expectations for possible further government easing. Credit fared well, especially high yield, despite weakness in equities. Interestingly, on an estimated-inflation standpoint, long treasury bonds have reached new all-time lows from a ‘real yield’ standpoint. Foreign bonds experienced a strong week in both developed and emerging markets, due to a drop in the dollar.
Commodities generally rose last week, with help from a weaker dollar, as precious metals gained several percent, followed by industrial metals and energy. The price of West Texas crude oil was up slightly on the week to just over $41/barrel, although natural gas prices shot up 9% on additional air conditioning needs. Precious metals strength (new highs in gold) has been helped by extremely low real interest rates in the U.S., which has eroded some of the diversification power of long-maturity treasuries, as well as the large federal deficit and debt load—which raises long-term inflation fears.
Mortgage Rates
“While housing demand continues to rebound, the month-long swoon in economic activity has caused the 10-year Treasury benchmark to drop. In the short-term, this means the demand will continue on the back of near record low mortgage rates,” said Sam Khater, Freddie Mac’s Chief Economist. “However, the most recent consumer spending data has been pointing to slow growth since mid-June. The concern is that the pause in economic activity will cause unemployment to remain elevated which will lead to longer-term labor market distress.”
The 30-year fixed-rate mortgage averaged 3.01 percent with an average 0.8 point for the week ending July 23, 2020, up slightly from 2.98 percent. A year ago at this time, the 30-year FRM averaged 3.75 percent.
The 15-year fixed-rate mortgage averaged 2.54 percent with an average 0.7 point, up from last week when it averaged 2.48 percent. A year ago at this time, the 15-year FRM averaged 3.18 percent.
The 5-year Treasury-indexed hybrid adjustable-rate mortgage (ARM) averaged 3.09 percent with an average 0.3 point, up slightly from last week when it averaged 3.06 percent. A year ago at this time, the 5-year ARM averaged 3.47 percent.
Average commitment rates should be reported along with average fees and points to reflect the total upfront cost of obtaining the mortgage. Visit the following link for the Definitions. Borrowers may still pay closing costs which are not included in the survey.

Through our relationship with Prestige Home Mortgage in Vancouver, Washington we originate residential and reverse mortgages. Check us out at https://beaconrwa.com and our affiliated websites at https://reverse-mortgages.us and https://socialsecurityquestionsanswered4u.com.
Sources: Ryan Long, CFA, FocusPoint Solutions, American Association for Individual Investors (AAII), Associated Press, Barclays Capital, Bloomberg, Citigroup, Deutsche Bank, FactSet, Financial Times, Goldman Sachs, JPMorgan Asset Management, Marketfield Asset Management, Morgan Stanley, MSCI, Morningstar, Northern Trust, Oppenheimer Funds, PIMCO, Standard & Poor’s, StockCharts.com, The Conference Board, Thomson Reuters, T. Rowe Price, U.S. Bureau of Economic Analysis, U.S. Federal Reserve, Wall Street Journal, The Washington Post. Index performance is shown as total return, which includes dividends, with the exception of MSCI-EM, which is quoted as price return/excluding dividends. Performance for the MSCI-EAFE and MSCI-EM indexes is quoted in U.S. Dollar investor terms.
The information above has been obtained from sources considered reliable, but no representation is made as to its completeness, accuracy or timeliness. All information and opinions expressed are subject to change without notice. Information provided in this report is not intended to be, and should not be construed as, investment, legal or tax advice; and does not constitute an offer, or a solicitation of any offer, to buy or sell any security, investment or other product. FocusPoint Solutions, Inc. is a registered investment advisor.
Notes key: (+) positive/encouraging development, (0) neutral/inconclusive/no net effect, (-) negative/discouraging development.