Your Weekly Update for Monday, August 23, 2021.
Beacon Rock Wealth Advisors is a financial planning and registered investment advisory firm in Camas, Washington. We are always available to answer your finance questions. Give us a call at (800) 562-7096 or send an email to info@beaconrwa.com.
If you or someone you know is worried about retirement, send us an email or give us a call for a no-obligation Retirement and Social Security Analysis.
If this information is helpful to you, please forward this to a friend and ask them to subscribe at https://newsletters.beaconrwa.com/subscribe.
Have a great week!
Mike Elerath
CERTIFIED FINANCIAL PLANNERTM
CERTIFIED IN LONG-TERM CARE
NATIONAL SOCIAL SECURITY ADVISOR
Mike.Elerath@beaconrwa.com
Bill Roller
NMLS #107972
CHARTERED FINANCIAL ANALYST
CERTIFIED FINANCIAL PLANNERTM
CHARTERED MARKET TECHNICIAN
bill.roller@beaconrwa.com
For more information about Beacon Rock Wealth Advisors, check out our brochure here: https://beaconrwa.com/wp-content/uploads/2020/04/BeaconRockBrochure.pdf
Summary
Markets were down last week. The Dow Jones Industrial Average fell 1.11to 35,120.08 while the S&P500 ended down 0.59% to 4,441.67. The Nasdaq Composite fell 0.73% to 14,714.66. The annual yield on the 30-year Treasury fell 7.4 basis point(s) to 1.874%.
Economic data for the week included weakness in retail sales, housing, as well as regional manufacturing sentiment. On the other hand, industrial production and jobless claims improved.
Global equity markets suffered net declines last week, as the headwinds of the Covid delta variant, potentially peaking growth, and higher potential for a Federal Reserve ‘taper’, all weighed on investor sentiment. Bonds fared decently as flows moved away from risk assets, driving down rates. Commodities suffered sharp declines, as the above-noted factors were assumed to threaten economic activity and goods demand.
Economic Notes
(-) Retail sales for July reversed course by falling -1.1%, beyond the median forecast calling for -0.3%. However, prior data for several recent months was revised higher. The headline decline was highlighted by weakness in auto sales of -4% (with a mental adjustment probably necessary to account for the fact that few new cars are available in inventory, due to the ongoing supply issues), as well as slower internet/non-store sales; on the other hand, restaurants/bars led with an increase of 2%. Removing the more volatile components, core/control retail sales was similar to the headline number, falling -1.0%. On a year-over-year basis, retail sales remain up 16%, or 18% versus the level just prior to Covid shutdowns. The ‘disappointing’ report wasn’t as bad as it may have appeared, with extreme swings over the past several months caused by government stimulus checks, tight inventories for certain goods, and continued reopenings offset by rising delta variant concerns.
(+) Industrial production in July rose by 0.9%, beating the expected gain of 0.5%; this also included revisions for prior months. Manufacturing production gained 1.4%, as a subcomponent, due entirely to an 11% increase in auto production, offsetting lesser gains in other groups. Mining production (which includes oil/gas extraction) gained over a percent for the month, but remains in the negative on a year-over-year basis as energy activity continues to lag the broader economic recovery. Capacity utilization for July ticked up by 0.7% to 76.1%—continuing its climb in this cycle, but still short of the 80-85 level seen as a peak rate in cycles of prior decades.
Within U.S. manufacturing, the inventory-to-sales ratio has fallen from its 1.4-1.5x level over the last decade to about 1.1x today. This implies very little or no buffer for the replacement of sold goods (usually absorbed by some degree of inventory), in addition to restocking delays. While viewed as a temporary condition, due to Covid supply chain issues, this could annoyingly persist longer than some expect.
(0/-) The Empire manufacturing index fell in August by a dramatic -24.7 points from a record high the prior month, but remained at an expansionary 18.3 level. Under the hood, new orders, shipments, and employment all decelerated, but remained in expansion. Prices paid remained high, with a meager decline of less than a point. On the other hand, expected business conditions for the next six months rose by 7 points, further into expansion.
(0/-) The Philadelphia Fed manufacturing index fell by -2.5 points in August, but remained at a still-expansionary 19.4 level. Under the hood, new orders and employment rose further into expansion, while shipments fell by -6 points, but remained in expansion. Prices paid ticked slightly higher to a still-elevated level. Assessments of business conditions six-months out fell by -15 points, but remained at a strongly expansionary 34 reading. While there has been some paring back of these two manufacturing measures, due to inflation concerns certainly, but also perhaps due to the impact of the delta variant on economic activity. However, month-to-month results are noisy, with the multi-month trend a more important indicator.
(-) Housing starts in July fell by -7.0% to a seasonally-adjusted rate of 1.534 mil. units, further than the -2.6% decline expected. Multi-family starts fell by -13%, which surpassed the -5% drop in single-family units. While starts in the South gained slightly, the other three regions lost ground, led by starts in the Northeast down -50% for the month. Building permits, on the other hand, reversed course to rise 2.6% to 1.635 mil. units—surpassing the expected 1.0% rise. Multi-family led, with an 11% increase, offsetting single-family starts, which fell back by -2%. The West and Midwest saw gains in permits, while the South and Northeast fell back slightly. Starts remain up just a few percent from this time last year, with double-digit gains in single-family offsetting a sharp drop in multi-family starts, in keeping with a slowdown in commercial real estate broadly. While this series remains volatile month-to-month, projects categorized as ‘authorized but not yet started’ represents a substantial component of current starts. The 6-month moving average of starts and permits are just off their cycle peak, when measured on a population-adjusted basis, after moving nearly straight up from last year, and in a strongly positive direction since 2008.
(-) The NAHB homebuilder sentiment index fell by -5 to 75 in August. Present sales and prospective homebuyer traffic both fell in line with the broader index, while future sales over the next six months were unchanged. While disappointing, and well below highs from late 2020, the indicator remains well above typical pre-Covid readings. From the anecdotal comments, it appears continued high material costs (despite a -75% correction-from-peak in lumber prices), trouble in finding skilled labor, and rising home price sticker shock appear to be affecting consumer choices at the margin.
(+) The Conference Board Index of Leading Economic Indicators for July rose by 0.9%, a 0.4% improvement on the prior month, and continuing a multi-month recovery. Individual indicators were strong across the board, led by credit, ISM new orders, interest rate spread, and stock prices. The growth pace of the past six months was an annualized 11.0%, which surprisingly exceeded the 10.2% pace of the six months before that (ending Jan. 2021).
The coincident and lagging economic indicators each rose by 0.6% for the month, in keeping with trend. Again, none of these data points are new, but the correlation of all to economic growth has remained high—and all pointing to continued improvement over the next year (and few signs of recessionary risk in the near-term).

Source: The Conference Board. Shaded areas indicate recessions, as defined by the NBER.
(+) Initial jobless claims for the Aug. 14 ending week fell by -29k to 348k, further than the 364k level expected by consensus. Claims were mixed by state, with no dramatic improvements or deteriorations. Continuing claims for the Aug. 7 week dropped by -79k to 2.820 mil., still above the 2.800 mil. median estimate. There continues to be a divergence between states where early ending of benefits has and has not occurred, as would be expected. In looking at the entire picture of emergency benefits and program extensions, it appeared that late July claims fell by another -370k to around 6.7 mil. These measures continue to show improvement, although the underlying unemployment count is so large, the unwinding is taking longer than government officials would like.
(0) The FOMC minutes from the July meeting noted that ‘most’ attendees felt that a reduction in asset purchases of treasuries and agency-mortgage backed securities (aka ‘tapering’) would be appropriate sometime in 2021, assuming the current pace of economic normalization continues. For perspective’s sake, the Fed is currently buying $120 bil. of securities each month ($80 bil. treasuries and $40 bil. MBS). A ‘taper’ could entail a reduction of this amount by -$10 bil. to -$20 bil. or so (composition between the two categories to be determined, but the same 2-to-1 ratio would be logical). The timeline remains now under debate, with thoughts of November or December seeming to be the base case by economists (who often come to consensus on such things), with an announcement at their Jackson Hole conference this week another possibly to ‘test the waters’. Assuming the taper lasts a year or so, based on that trajectory, only then would interest rate increases begin. The potential start time of such rate increases following the end of tapering will likely also be closely-followed. That assumes everything goes according to plan, with no wrinkles or downturn in the meantime to warrant a pause in this unwinding of stimulus, due to a more severe delta variant reaction, or economic growth peaking and decelerating faster than models assume.
It’s easy to get caught up in the week-to-week analysis of this, as markets do, but even the beginning of a taper is nowhere near the severity of what the Fed would implement in past decades—such as ‘surprise’ policy hikes on the order of a half-percent or so. It’s simply a pullback in very large purchases the Fed has been engaged in—in some cases lately, buying the entire bulk of treasury auction issuance. The pullback in buying will either leave more room for natural buyers of longer-term treasury and agency mortgage-backed bonds, or, long-term rates may need to drift a bit higher (as demand wanes, driving prices down). The pace of change is likely to be gradual, with the Fed very sensitive to its large impact on bond markets in recent years, which have grown used to Fed intervention. This will be difficult to wean away from in the near-term. However, a market without regular central bank intervention is no doubt healthier over the long-term. If it doesn’t start soon, it’s difficult to imagine when a better time may come.
Market Notes
| Period ending 8/20/2021 | 1 Week (%) | YTD (%) |
| DJIA | -1.01 | 16.13 |
| S&P 500 | -0.55 | 19.36 |
| NASDAQ | -0.70 | 14.67 |
| Russell 2000 | -2.47 | 10.39 |
| MSCI-EAFE | -2.95 | 9.21 |
| MSCI-EM | -4.62 | -4.10 |
| BBgBarc U.S. Aggregate | 0.16 | -0.65 |
| U.S. Treasury Yields | 3 Mo. | 2 Yr. | 5 Yr. | 10 Yr. | 30 Yr. |
| 12/31/2020 | 0.09 | 0.13 | 0.36 | 0.93 | 1.65 |
| 8/13/2021 | 0.06 | 0.23 | 0.79 | 1.29 | 1.94 |
| 8/20/2021 | 0.05 | 0.23 | 0.80 | 1.26 | 1.87 |
The surprise fall of the government in Afghanistan over the prior weekend contributed to some cautious sentiment, but was not as sharp as some feared. Aside from the humanitarian and geopolitical concerns, the Afghanistan is viewed as a large depository for rare earth minerals, which could potentially fall into Chinese hands. More immediately, it appeared to be coupled with fears over a peaking growth trajectory in the U.S., particularly with rising delta variant cases, despite record earnings reports continuing to come through for Q2. As noted earlier, the release of minutes from the July Fed meeting on Wed. confirmed some suspicions that the FOMC appears interested in a ‘taper’ beginning later this year (as opposed to the market ‘best case’ scenario of early 2022). Markets down a few percent don’t quite indicate another ‘tantrum’, but Fed language continues to be scrutinized for clues. In an immediate example, Friday saw a bounceback as soon as the President of the Dallas Fed publicly questioned pulling back on stimulus as Covid continued to rage on.
By U.S. sector last week, only defensive health care and utilities fared decently, up 2% each, while most cyclical sectors declined—led by energy down over -7%, in keeping with weaker oil prices. Real estate was also up slightly. In keeping with recent trends, small caps underperformed large caps, due to their embedded greater sensitivity to cyclical movements. The Russell 2000 actually moved into -10% correction territory briefly.
Foreign stocks experienced lower returns than domestic names, not helped by a sharply stronger U.S. dollar last week—Europe and Japan experienced similar results. Similar concerns over the intensifying delta variant appeared to weigh on sentiment, and its potential effects on recovery growth. Interestingly, in contrast to the U.S., U.K. inflation came in at a rate of only 2.1%, with that in the Eurozone up 2.5%. Emerging market stocks were down sharply across the board, from China and Brazil, to South Africa—all down 5-10%. Chinese stocks fared negatively early in the week, with fears of a more substantial growth slowdown, as well as additional regulation aimed at data privacy/usage by companies, as well as niche restrictions such as prohibition of fake product reviews (no doubt many in the U.S. would be in favor of similar rules involving the latter).
U.S. bonds gained as assets moved to ‘risk off’ during the week, driving interest rates lower at the longer end of the treasury curve. Treasuries outperformed both investment-grade and high yield bonds, as spreads widened. As the U.S. dollar strengthened by about a percent, foreign bonds declined sharply, led by weakness in emerging market local debt.
Commodities fell across the board last week, as fears of the delta variant affecting the global growth recovery pace weighed on pricing, as did a substantially stronger dollar. Aside from little change in precious metals, energy, industrial metals, and agriculture all declined upwards of -5%. The price of crude oil corrected sharply, by over -9% to just over $62/barrel—a three-month low.
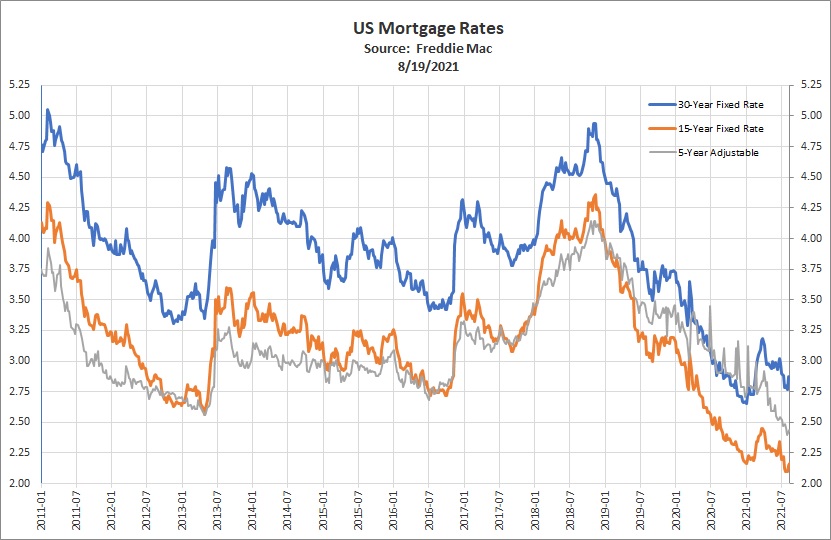
Mortgage Rates
“Mortgage rates stayed relatively flat this week,” said Sam Khater, Freddie Mac’s Chief Economist. “Housing is in a similar phase of the economic cycle as many other consumer goods. While there is strong latent demand, low supply has caused prices to rise as shortages restrict the amount of sales activity that otherwise would occur.”
The 30-year fixed-rate mortgage averaged 2.86% with an average 0.7 point for the week ending August 19, 2021, down slightly from last week when it averaged 2.87%. A year ago at this time, the 30-year FRM averaged 2.99%.
The 15-year fixed-rate mortgage averaged 2.16% with an average 0.6 point, up slightly last week when it averaged 2.15%. A year ago at this time, the 15-year FRM averaged 2.54%.
The 5-year Treasury-indexed hybrid adjustable-rate mortgage (ARM) averaged 2.43% with an average 0.3 point, down slightly from last week when it averaged 2.44%. A year ago at this time, the 5-year ARM averaged 2.91%.
Freddie Mac’s Primary Mortgage Market Survey® is focused on conventional, conforming, fully amortizing home purchase loans for borrowers who put 20% down and have excellent credit. Average commitment rates should be reported along with average fees and points to reflect the total upfront cost of obtaining the mortgage. Borrowers may still pay closing costs which are not included in the survey.
Through our relationship with Prestige Home Mortgage in Vancouver, Washington we originate residential and reverse mortgages.
Cryptocurrencies
| Name | Symbol | Price | 7d % | 30d % | YTD % | Market Cap |
| Bitcoin | BTC | $50,247.51 | 7.59% | 48.32% | 71.10% | $944,625,911,064 |
| Ethereum | ETH | $3,348.77 | 3.43% | 54.71% | 357.86% | $391,993,608,558 |
| Cardano | ADA | $2.84 | 33.61% | 134.42% | 1520.86% | $91,312,778,772 |
| Binance Coin | BNB | $502.89 | 17.82% | 66.59% | 1232.63% | $84,931,370,289 |
| Dogecoin | DOGE | $0.32 | 3.82% | 63.95% | 5553.78% | $42,098,190,388 |
Information current as of 6:50 AM, Monday, August 23, 2021. Source: https://coinmarketcap.com.
Check us out at https://beaconrwa.com and our affiliated websites at https://reverse-mortgages.us and https://socialsecurityquestionsanswered4u.com.
Sources: Ryan Long, CFA, FocusPoint Solutions, American Association for Individual Investors (AAII), Associated Press, Barclays Capital, Bloomberg, Citigroup, Deutsche Bank, FactSet, Financial Times, Goldman Sachs, JPMorgan Asset Management, Marketfield Asset Management, Morgan Stanley, MSCI, Morningstar, Northern Trust, Oppenheimer Funds, PIMCO, Standard & Poor’s, StockCharts.com, The Conference Board, Thomson Reuters, T. Rowe Price, U.S. Bureau of Economic Analysis, U.S. Federal Reserve, Wall Street Journal, The Washington Post. Index performance is shown as total return, which includes dividends, with the exception of MSCI-EM, which is quoted as price return/excluding dividends. Performance for the MSCI-EAFE and MSCI-EM indexes is quoted in U.S. Dollar investor terms.
The information above has been obtained from sources considered reliable, but no representation is made as to its completeness, accuracy or timeliness. All information and opinions expressed are subject to change without notice. Information provided in this report is not intended to be, and should not be construed as, investment, legal or tax advice; and does not constitute an offer, or a solicitation of any offer, to buy or sell any security, investment or other product. FocusPoint Solutions, Inc. is a registered investment advisor.
Notes key: (+) positive/encouraging development, (0) neutral/inconclusive/no net effect, (-) negative/discouraging development.