Your Weekly Update for Monday, January 11, 2021.
Beacon Rock Wealth Advisors is a financial planning and registered investment advisory firm in Camas, Washington. We are always available to answer your finance questions. Give us a call at (800) 562-7096 or send an email toinfo@beaconrwa.com.
With this volatility in the markets, you may have questions about your portfolio. We are both available by Zoom or Skype to answer your questions. Call or email and we will get it set up.
Please support your local small businesses. Go get some take-out from your favorite restaurant!
If you or someone you know is worried about retirement, send us an email or give us a call for a no-obligation Retirement and Social Security Analysis.
If you find this information useful, please forward this newsletter to a friend and ask them to subscribe at https://newsletters.beaconrwa.com/subscribe.
Have a great week!
Mike Elerath
CERTIFIED FINANCIAL PLANNERTM
CERTIFIED IN LONG-TERM CARE
NATIONAL SOCIAL SECURITY ADVISOR
Mike.Elerath@beaconrwa.com
Bill Roller
NMLS #107972
CHARTERED FINANCIAL ANALYST
CERTIFIED FINANCIAL PLANNERTM
CHARTERED MARKET TECHNICIAN
bill.roller@beaconrwa.com
For more information about Beacon Rock Wealth Advisors, check out our brochure here: https://beaconrwa.com/wp-content/uploads/2020/04/BeaconRockBrochure.pdf
Summary
Markets had a big up week to start 2021. The Dow Jones Industrial Average rose 1.61% to 31,097.97, while the S&P500 rose 1.83% to 3,824.68. The Nasdaq Composite rose 2.43% to end at 13,201.98. The annual yield on the 30-year Treasury fell spiked 21.7 basis points to 1.863%.
Economic data for the week included stronger reports for ISM manufacturing and services, while the employment situation for December weakened more than expected.
Equity markets rose several percent globally, with the U.K. and emerging markets leading other regions, with hopes for larger U.S. stimulus upon the victory of both Georgia Democratic Senate candidates, and in spite of a riot at the U.S. Capitol. Bond prices fell back as interest rates ticked higher based on additional stimulus expectations. Commodities rose, with continued recovery gains in crude oil—which rose back above $50/barrel.
Economic Notes
(+) The ISM manufacturing index for December increased 3.2 points to 60.7, which surpassed the 56.8 reading expected, and reaching its highest level in two years. Underlying components showed strength in every category, as production, new orders, employment, supplier deliveries, and inventories all gained and remained solidly in expansion. Prices paid also rose over 12 points, showing significant expansion overall, with gains in over three dozen commodity prices for the month.
(+) The ISM non-manufacturing index also rose in December, albeit by a lesser 1.3 points to 57.2, beating expectations calling for 54.5. Under the hood, business activity and new orders each rose over a point into further expansion, and supplier deliveries and net export orders even more so. On the other hand, prices paid declined slightly but remained in expansion, and employment dipped by several points back into contraction.
(0) Construction spending rose by 0.9% in November, just a tick below the 1.0% growth expected, although several prior months were revised higher by several tenths of a percent. For the single month, private residential spending gained nearly 3% to lead the overall report, while public residential also gained a half-percent. Nonresidential spending in both the private and public spheres declined during the month.
(-) The trade balance in November widened further into deficit by -$5.1 bil. to -$68.1 bil., wider than the -$67.3 bil. level expected. Trade volumes have increased steadily for the past six months, with imports rising several times more than exports, actually returning close to prior levels. Exports saw a gain in petroleum, but was far more offset by a decline in other goods.
(-) The ADP private employment report showed a decline of -123k jobs in December, disappointing relative to expectations calling for a gain of 75k jobs. Services jobs fell by -105k, the majority of which were in leisure/hospitality, which is in keeping with further virus counts. Jobs in goods production (a far smaller group), declined by -18k, all of which were accounted for by manufacturing job losses.
(+) Initial jobless claims for the Jan. 2 ending week fell by -3k to 787k, lower than the 800k level expected. Continuing claims for the Dec. 26 week came in -126k lower, to 5.072 mil., and below the 5.200 mil. expected by consensus. However, continuing claims have tended to not capture the full impact of benefit extensions. The initial claim figure was driven by a sharp drop in IL, while several other states in the central U.S. experienced increases that largely offset the impact.
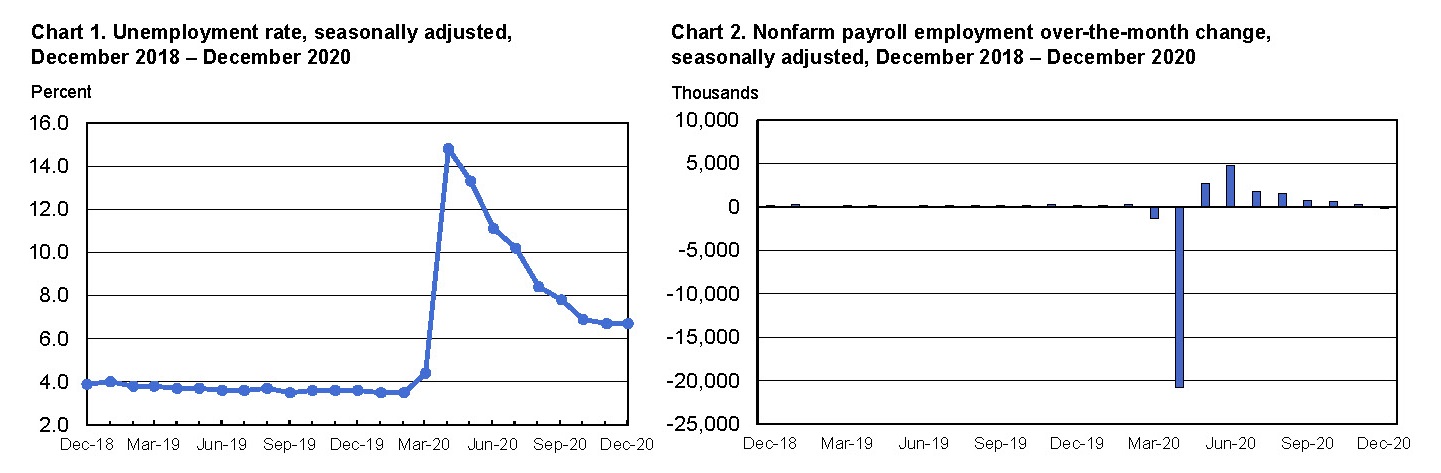
(-) The employment situation report showed deterioration in December as rising Covid cases and containment efforts/lockdowns put a damper on economic activity. In closing out the year, the underlying data showed a rise in workers laid off temporarily due to the virus wave, and pullback in activity, which skews the official results. Workers permanently losing jobs, though, continues to decrease (trends are shown in the charts below, which show steady improvement from the depths of the early pandemic). While a difficult stretch, expectations for 2021 are better, but depend on vaccine distribution and perhaps additional government stimulus.
Nonfarm payrolls fell by -140k for the month, which disappointed relative to already-tempered expectations of a gain of 50k. This was the first outright decline in payrolls since the beginning of the pandemic; however, the prior few reports were revised upward by a total of 135k. As expected, the largest job declines were concentrated in leisure/hospitality (-500k), which included restaurants, gaming, hospitality, and other recreation. Private education jobs also declined (-63k), as did government jobs (-45k). On the other hand, professional/business services (161k) and retail (121k) saw gains, as did construction, warehousing, and manufacturing, to lesser degrees.
The unemployment rate was unchanged at 6.7%, despite expectations calling for a tick upward by 0.1% or so. However, the classification of ‘employed but not at work’ category may have kept this lower than actual unemployment effect due to temporary virus-related factors, and has made this episode more difficult to officially measure than a typical recession. The U-6 underemployment rate fell by -0.3% to 11.7%, which a decreasing number of workers classified as part-time. While at improved rates versus the depths of the recession last year, unemployment and underemployment rates remain at roughly double pre-Covid levels.
According to the Bureau of Labor Statistics, Average hourly earnings rose by 0.8% to $29.81, beating expectations of a mere 0.2% increase, which brought the year-over-year rate of increase to 5.1%. Average weekly hours fell by -0.1 to 34.7 hours.
Question of the Week: What could we expect in 2021?
Each year naturally brings more surprises than certainties, so outlooks and predictions of any kind quickly become futile. (We’ve already experienced a dramatic and unusual first week of January.) At least at this point in time, noted are a few key issues to monitor as 2021 gets going:
- Covid pandemic. This is the one carryover from 2020 everyone would like to forget. Unfortunately, it remains the single most important issue for both global medical and economic health going into 2021. While acknowledging the loss and hardship for many over the past year, the pandemic has also led to many examples of resiliency. It has resulted in a relatively smooth transition into work-from-home environments for some, but has also caused immeasurable problems for vulnerable cyclical industries forced to close or operate at reduced capacity. The development of several effective vaccines has taken an open-ended economic disaster and turned it into one with a clearer end game, assuming their distribution and effectiveness across populations go as planned. Mid-2021 is the current estimate for higher levels of implementation across the broader population (a goal of near-herd immunity) and some semblance of a ‘back to normal.’ But so far, logistics have been slow for vaccine rollout, so the economic normalization process seem more likely to be pushed back than bumped up, but the situation remains fluid. (Many are watching the rollout process in Israel, which has handled logistics very quickly and already inoculated nearly a quarter of their population, for clues.) The discovery of a new strain of Covid adds additional uncertainty to the mix, with hopes from health professionals that current vaccine technology won’t be derailed by this or further virus mutations.
- Presidential actions. The election of Joe Biden has led to assumed better consistency of behavior in the executive branch, but has also moved policy several ticks toward the left. Relative to others in the Democratic party, though, Biden is considered a ‘centrist’ and finder of common ground. In the best case, this may result in legislation backed by both sides of the aisle. However, last week’s riot at the U.S. Capitol is an important reminder of how divided the nation remains, which could challenge the effort of national reconciliation. Some tempering of rhetoric and actions could be seen in the areas of tariffs/trade and executive orders, where the President has broader unilateral authority.
- The two U.S. Senate runoff elections in Georgia on Jan. 5 were as closely-watched as any in recent years. While Republicans were expected to retain the seats, pollsters ended up with egg on their faces again, as both Democratic candidates won by narrow margins. This puts the Senate at 50-50, for only the fourth time in history. (Officially, the Democratic 50 includes two independent Senators, one of which is Bernie Sanders, who caucuses with the Democrats.) This equal split puts the deciding vote into the hands of incoming Vice President-Elect Kamala Harris, which is significant. While early descriptions of this result were as a ‘blue wave,’ many pundits have downgraded the impact to more like a ‘blue ripple’ in reality. This Democratic majority, albeit by narrower margins, could well result in further stimulus (early in 2021) and movement on infrastructure (which both parties actually agree on in principle, despite differing details—mostly in the green energy area). This could also include tightening up ACA/Obamacare, as well as procedural changes like altering the filibuster rule. Importantly, the majority gives Biden a smoother road for Senate-required approval of certain Presidential nominations. At the same time, the slim margin, and reduced Democratic majority in the House after the 2020 election, makes more extreme initiatives in health care (as in a full ‘Medicare for All’), the environment, tax law, etc. a bit more difficult to push through.
- Economic growth. The recovery in the economy continues to be almost completely dependent on the course of the pandemic and its abatement, driving estimates in both directions in recent months, along with unpredictable virus case counts. The expected -3% to -5% decline in U.S. GDP growth in 2020 is predicted to reverse to a potential mid-single digit gain in 2021 (give or take a few percent). Despite the initial trepidation about the Georgia race, the expected additional stimulus to be rolled out by a Democratic administration and Congress would be sure to have a positive effect on business and consumer spending in 2021-22, leading to even stronger GDP growth than with the late 2020 stimulus alone. (This is despite concerns of the budget deficit and high debt load down the road.) The recovery growth rate could be roughly double long-term trend growth of 2.0-2.5%, but relies on the mid-year majority vaccination timeline. With the pandemic-led recession marking the end of the last (and historically-long) business cycle, a new cycle is beginning anew. This is expected to lead to recovered corporate earnings growth in coming years—the critical long-term driver of equity returns. While some bearish observers see financial markets as looking too optimistic on 2021, based on higher price multiples, more bullish watchers see the pandemic recovery potentially more akin to the years after World War II, which benefitted from a liftoff from stagnant production and pent-up consumer demand. In fact, some have gone as far as to label the coming decade a potential new ‘Roaring Twenties.’ (Interestingly, the original ‘Roaring 1920’s’ came after the 1918 influenza pandemic.)
- Interest rates. As they’ve stated directly, the Federal Reserve is committed to keeping rates low through the pandemic and for a while beyond. Some feared rates might be taken into negative territory, as in Europe, but that appears increasingly less likely due to logistical reasons, and far more pushback against it in the U.S. Long rates are also held lower by Fed purchases of treasuries and mortgages, but if inflation expectations were to rise, pressure could be felt on the long end of the yield curve first. The overall accommodative stance is likely to continue until recovery has taken hold, and until inflation picks up (over 2.0-2.5%) for a period of time. In the past week, the 10-year treasury rose over 1.0% again as higher political odds for more stimulus (and a greater debt load) have raised the chances of higher economic growth and accompanying inflation. Overall, though, continued secular trends based on aging demographics and inconsistent productivity growth point to a consensus view that interest rates overall could stay relatively low for some time.
- Financial stability. This is an area not often discussed, due to so much focus on the short-term. What determines stability? For the most part, it’s an absence of excesses—that often include over-speculation in certain asset classes, taking on too much leverage, and higher destabilizing inflation. The 2007 housing market is a recent historical example of such an inflating and bursting bubble, but there are many historical examples. Due to well-known economist Hyman Minsky’s work in this area, the popping of such an unsustainable condition has been referred to as a ‘Minsky Moment.’ This is akin to the single snowflake that triggers a seemingly random avalanche, which is actually not random at all, but a condition that becomes increasingly likely over time as conditions build to more unstable levels. This may not be the case at the moment, being on the back end of a recession. But, over time, red flags such as exuberant sentiment without regard to any fundamentals, continued rising debt levels without regard for consequences, or the ignoring of any bad news that could derail a recovery, could all be signs of growing financial instability.
- Investment Markets:
- S. stocks. Investors have looked at the equity market with amazement, as stock prices moved almost straight back up after a -33% crash. Historically, though, such a result is not so unusual, with stocks often discounting the worst news and looking ahead toward a brighter future (even if a year or more away in reality). Valuations are a bit rich, based on expectations for 2021 revenue and earnings, with multiples appearing to look further into 2022 and even 2023 for fundamentals that justify current pricing. ‘Growth’ stocks, especially in technology and communications feature strong fundamentals, which have resulted in higher valuations, especially with today’s low interest rates. Are signs of the late 2020 rally in cyclical ‘value’ companies here to stay? Or, will a reemergence of challenges cause investors to again seek out the stability of ‘growth’? Uncertainty remains, but the coming year may offer more clues.
- Anti-trust issues and growth stocks. It’s been wondered whether current conditions are like the 2000 dot-com bubble, based on the extreme differential between ‘growth’ and ‘value’ sector performance. One difference, though, is that fundamentals (like profits) for today’s tech and communications companies are far more robust than at that time (in 2000, profits were often more hope than reality). In fact, high scores for the ‘quality’ factor have been a reason for the strong positive sentiment for that group. The pandemic’s challenges for smaller firms have caused even more consolidation of market share towards the biggest players. This begs the question: are these firms too dominant? There has been some increasing pressure for anti-trust legislation aimed at several mega-cap tech companies, but uncertainty about how that would look. There are some problematic legal issues. Does Congress really want to ‘punish’ the segment of the economy that has proven most resilient and efficient during the pandemic? Anti-trust typically requires a ‘damaged’ party, via price gouging or anti-competitive behavior. Do these services take unfair advantage of consumers (since they’re often free)? Do they suppress competition (or merely offer a better product)? These aren’t easily rectified.
- Foreign stocks. Covid has challenged populations and businesses on a global level. While U.S. markets were seen as a safe haven in 2020 due to demand for leading technology/communications firms residing in the U.S., foreign markets offer more cyclicality, so an embedded ‘value’ bet of sorts. They also offer more relatively attractive valuations, less positive sentiment, and have been on the losing end of the U.S. vs. World equity performance trade for several years (the typical historical length for such dominance prior to a reversal). Emerging markets, in particular, have suffered high costs during the pandemic, and offer strong potential for recovery growth, due to a more modest starting point and more favorable demographics.
- An important relationship in fixed income is that total returns one should expect for coming years are mathematically tied to starting yields. This doesn’t bode well for those hoping for results like the past few decades, where rates were in a steady decline (from a peak in the early 1980’s) to today’s low levels. Credit spreads are also tighter than they were in much of 2020, with corporate improvement priced in. At the same time, while one shouldn’t necessarily expect great things from fixed income, the diversification element remains important should risk markets experience volatility. As a case in point, while interest rates were already considered low a year ago, and caution for bonds was everywhere, long-term U.S. treasuries earned 15%+ returns in 2020. Foreign bonds are an even more challenged environment, with a substantial percentage of debt offering negative yields, with price returns largely driven by currency markets.
- Real estate. Last year was best described as one split between the ‘haves’ and ‘have-nots’ in the real property realm. Winners included newer niches of real estate markets that benefit from technological immersion, such as data centers and cell phone towers, and distribution centers that catered to online shopping. Valuations have risen for these assets, although fundamentals remain strong as they take a greater place in REIT indexes. Losing groups include the obvious, such as shopping malls, other retail, and travel/lodging. These represent the industries most heavily affected by lockdowns, although valuations have fallen to depressed levels, and could offer attractive sensitivity to further recovery. Office properties look to remain mixed, with some faring better than expected in the near-term, while the long-term strategic trend toward less office space/working from home has accelerated. Real estate in general has been supported by record-low financing rates, which is of course Fed-dependent.
- It’s easy for investors to forget that the real estate universe is the world’s largest asset class, by overall size, and is extremely diverse. Owners of real estate assets are similarly quite diverse. On one end are residential homes and small commercial properties, which experienced contrasting results during the pandemic—strong house price increases bookended by retail locations having trouble making lease payments. So, the knee-jerk response is to cast commercial property overall in the bucket of ‘doomed’ asset. In some cases, this may be true, and has been for some time (notably in weaker strip malls in less desirable locations, and the like). However, as an institutional investment asset class, REITs generally focus their efforts on the largest, highest quality properties, in the most desirable locations (such as New York, London, etc.). While these are still sensitive to the business cycle, they’re often far less so (by design), and are far more liquid, than stand-alone properties profiled in news stories or owned in private partnerships. While there is some overlap due to similar inputs, high-quality REITs and generic Main Street real estate can provide varying results.
- Index composition varies, but energy futures contracts remain the most famous member of the asset class. Petroleum demand is more predictable in normal times, but fell off a cliff in 2020 as the pandemic put a damper on both industrial production and consumer mobility. Manufacturing has bounced back first, in China and other Asian nations, with lockdowns eased earlier. As the global economy recovers, prices for crude oil and industrial metals may also rise, as they often do when economies ‘reflate.’ Precious metals earned strong returns in 2020 due to their ‘safe haven’ tendencies, although that faded later in the year when investors sought riskier assets. A continued weaker U.S. dollar and any signs of higher inflation readings could serve to be two of the more important catalysts for commodities movement in 2021. Their most important role, however, is their lack of correlation to other asset classes in a portfolio—which can be hard to find elsewhere and often goes unappreciated.
- The U.S. dollar weakened by -7% in 2020 relative to a basket of developed market currencies, but was little changed versus emerging market currencies. As always, currency movements represent a ‘two-way street.’ This was a slight erosion in confidence in the dollar’s safe haven status, due to unprecedented amounts of fiscal and monetary stimulus, but also expectations in improved growth abroad—particularly the euro and U.K. pound as markets look past Brexit. Will this trend continue? Currency markets are fickle to say the least, but a cyclical rebound could continue to favor foreign currencies, which could translate to tailwinds for international stocks and bonds, which have lagged those of the U.S. in recent years.
These represent only a few items to watch. No doubt 2021 will bring its share of more (and hopefully positive) surprises.
Market Notes
| Period ending 1/8/2021 | 1 Week (%) | YTD (%) |
| DJIA | 1.66 | 1.66 |
| S&P 500 | 1.88 | 1.88 |
| NASDAQ | 2.45 | 2.45 |
| Russell 2000 | 5.93 | 5.93 |
| MSCI-EAFE | 3.16 | 3.16 |
| MSCI-EM | 4.79 | 4.79 |
| BBgBarc U.S. Aggregate | -0.94 | -0.94 |
| U.S. Treasury Yields | 3 Mo. | 2 Yr. | 5 Yr. | 10 Yr. | 30 Yr. |
| 12/31/2020 | 0.09 | 0.13 | 0.36 | 0.93 | 1.65 |
| 1/8/2021 | 0.08 | 0.14 | 0.49 | 1.13 | 1.87 |
U.S. stocks began 2021 on a down note Monday, with rising Covid cases nationwide and uncertainty over Georgia’s dual-runoff Senate elections the following day beginning to concern investors, as polls showed far tighter races than expected. In a strange twist of fate, market results turned positive Wednesday despite the narrow Democratic victory (as discussed above), as well as when the chaos at the U.S. Capitol ended with a formal electoral certification of Joe Biden as President. As is often the case with domestic civil strife, markets were little affected directly. Later in the week, a disappointing jobs report added hope for another fiscal aid package led by Democrats.
By sector, cyclical energy and materials led with gains well over 5% each, followed by consumer discretionary stocks and financials. Defensive utilities and consumer staples lagged with minor declines. Small caps outperformed large caps by several percent, in keeping with the strength in cyclical assets. However, real estate also lost ground as interest rates ticked higher.
Foreign stocks outperformed U.S. stocks last week, led by the U.K. and emerging markets. Strong industrial results in Germany, as well as relief sentiment in the U.K. post-Brexit appeared to be primary catalysts for continued gains. As in the last few weeks, hopes for an improved post-Covid environment as vaccine distribution ramps up appears to be driving investor moods, as opposed to any differentiating factors regionally.
U.S. bonds fell back sharply last week, up to a percent or more in total return as interest rates ticked higher. However, treasuries outperformed investment-grade corporates. The bellwether 10-year treasury note yield crept back over the 1.0% level as the Georgia election results raised expectations for more government spending (as noted earlier). Floating rate bank loans ended the week as one of the few bond groups with positive returns in the U.S. Foreign bonds declined in both developed and emerging markets, as the U.S. again re-strengthened.
Commodities ticked higher along with other cyclical assets, bucking the headwind of the slightly stronger dollar. Energy led, coupled with gains in industrial metals, while precious metals fell back last week. The price of crude oil rose tipped over $50/barrel early in the week after Saudi Arabia unexpectedly announced a production cut of 1 mil. barrels/day for Feb. and March, offsetting slightly higher production for other nations. For the week, crude gained nearly 8% to over $52, followed by gains in natural gas.
Mortgage Rates
“A new year, a new record low mortgage rate,” said Sam Khater, Freddie Mac’s Chief Economist. “Despite a full%age point decline in rates over the past year, housing affordability has decreased because these low rates have been offset by rising home prices. However, the forces behind the drop in rates have been shifting over the last few months and rates are poised to rise modestly this year. The combination of rising mortgage rates and increasing home prices will accelerate the decline in affordability and further squeeze potential homebuyers during the spring home sales season.”
The 30-year fixed-rate mortgage averaged 2.65% with an average 0.7 point for the week ending January 7, 2021, down from last week when it averaged 2.67%. A year ago at this time, the 30-year FRM averaged 3.64%.
The 15-year fixed-rate mortgage averaged 2.16% with an average 0.6 point, down slightly from last week when it averaged 2.17%. A year ago at this time, the 15-year FRM averaged 3.07%.
The 5-year Treasury-indexed hybrid adjustable-rate mortgage (ARM) averaged 2.75% with an average 0.3 point, up from last week when it averaged 2.71%. A year ago at this time, the 5-year ARM averaged 3.30%.

Freddie Mac’s Primary Mortgage Market Survey® is focused on conventional, conforming, fully-amortizing home purchase loans for borrowers who put 20% down and have excellent credit. Average commitment rates should be reported along with average fees and points to reflect the total upfront cost of obtaining the mortgage. Visit the following link for the Definitions. Borrowers may still pay closing costs which are not included in the survey.
Through our relationship with Prestige Home Mortgage in Vancouver, Washington we originate residential and reverse mortgages. Check us out at https://beaconrwa.com and our affiliated websites at https://reverse-mortgages.us and https://socialsecurityquestionsanswered4u.com.
Sources: Ryan Long, CFA, FocusPoint Solutions, American Association for Individual Investors (AAII), Associated Press, Barclays Capital, Bloomberg, Citigroup, Deutsche Bank, FactSet, Financial Times, Goldman Sachs, JPMorgan Asset Management, Marketfield Asset Management, Morgan Stanley, MSCI, Morningstar, Northern Trust, Oppenheimer Funds, PIMCO, Standard & Poor’s, StockCharts.com, The Conference Board, Thomson Reuters, T. Rowe Price, U.S. Bureau of Economic Analysis, U.S. Federal Reserve, Wall Street Journal, The Washington Post. Index performance is shown as total return, which includes dividends, with the exception of MSCI-EM, which is quoted as price return/excluding dividends. Performance for the MSCI-EAFE and MSCI-EM indexes is quoted in U.S. Dollar investor terms.
The information above has been obtained from sources considered reliable, but no representation is made as to its completeness, accuracy or timeliness. All information and opinions expressed are subject to change without notice. Information provided in this report is not intended to be, and should not be construed as, investment, legal or tax advice; and does not constitute an offer, or a solicitation of any offer, to buy or sell any security, investment or other product. FocusPoint Solutions, Inc. is a registered investment advisor.
Notes key: (+) positive/encouraging development, (0) neutral/inconclusive/no net effect, (-) negative/discouraging development.