
Your Weekly Update for Monday, July 20, 2026.
Beacon Rock Wealth Advisors is a dba of BR Capital, Inc. It is a financial planning and registered investment advisory firm in Camas, Washington. We are always available to answer your questions. Give us a call at (360) 735-1900 or send an email.
If you or someone you know is worried about retirement, send us an email or give us a call for a no-obligation Retirement and Social Security Analysis.
If this information is helpful to you, please forward this to a friend and ask them to subscribe at https://newsletters.beaconrwa.com/subscribe.
Have a great week!
Bill Roller
NMLS #107972
CHARTERED FINANCIAL ANALYST
CERTIFIED FINANCIAL PLANNERTM
CHARTERED MARKET TECHNICIAN
bill.roller@beaconrwa.com
Summary
Markets were DOWN last week. The Dow Jones Industrial Average was DOWN 0.93% to 52,146.42 while the S&P500 ended DOWN 1.55% to 7,457.69. The Nasdaq Composite FELL 2.90% to 25,520.24. The annual yield on the 30-year Treasury FELL 0.7 basis point(s) to 5.064%.
Last Week
Closing Market Summary: Momentum unwind turns into broader retreat
The major averages finished near their session lows as afternoon selling broadened across the market, overwhelming an earlier recovery in semiconductor stocks. The S&P 500 (-1.0%), Nasdaq Composite (-1.4%), and DJIA (-0.8%) all ended firmly lower, both for the session and the week.
Semiconductor stocks briefly erased nearly all of their early losses around midday before turning lower again into the close. The PHLX Semiconductor Index fell 1.6%, while the information technology sector declined 1.1%. Cadence Design (CDNS 330.11, -34.54, -9.47%) was among the group’s weakest performers after Bloomberg reported that Moonshot AI’s Kimi K3 model designed a functional semiconductor chip in just 48 hours using open-source tools rather than proprietary electronic-design-automation software. Synopsys (SNPS 384.28, -32.76, -7.85%) was another laggard, while memory-related stocks held up comparatively well after recovering from sharp opening losses.
Weakness remained especially pronounced across mega-cap growth stocks. The communication services sector (-2.3%) finished with the widest loss as Meta Platforms (META 646.01, -18.53, -2.79%) and Alphabet (GOOG 346.12, -7.69, -2.17%) saw an extension of yesterday’s losses. Elsewhere in the sector, Netflix (NFLX 68.95, -5.40, -7.26%) plunged lower after a disappointing earnings report.
The Vanguard Mega Cap Growth ETF fell 1.5%, reflecting additional weakness across several of the market’s largest technology-oriented names.
The consumer discretionary sector (-1.6%) also finished among the laggards. Its mega-cap components traded lower, while travel-related stocks and homebuilders faced additional pressure as oil prices surged. The iShares U.S. Home Construction ETF fell 2.9%.
The deterioration was not confined to growth stocks. Early gains of more than 1% across several defensive sectors were fully erased, with health care (-0.4%), utilities (-0.7%), and consumer staples (-0.8%) all finishing lower. Intuitive Surgical (ISRG 345.42, -56.91, -14.15%) was the worst-performing S&P 500 component despite topping second-quarter estimates, as investors focused on an unchanged outlook that implies slower da Vinci procedure growth during the second half of the year.
The energy sector (+0.8%) was the only S&P 500 sector to post a gain as crude oil futures settled $2.69 higher (+3.4%) at $81.67 per barrel. Oil extended its advance after Axios reported that President Trump could decide within days whether to escalate military action against Iran, with options reportedly including strikes on Iranian infrastructure, nuclear facilities, and the underground Pickaxe Mountain site.
Ultimately, the semiconductor group’s midday recovery briefly offered some support, but it failed to alter the market’s broader trajectory. Renewed weakness in chipmakers, sustained pressure on mega-cap growth stocks, and a sharp reversal across previously stronger defensive areas left the major averages at their lows as rising oil prices and mounting geopolitical uncertainty weighed on sentiment.
U.S. Treasuries finished the week with modest gains in the 5-year note and longer tenors while the short end ended slightly lower after backtracking from early highs. The 2-year note yield settled up one basis point to 4.17% (-4 bais points this week), and the 10-year note yield settled down three basis points to 4.54% (-3 basis points this week).
- Russell 2000: +19.4% YTD
- S&P Mid Cap 400: +14.2% YTD
- Nasdaq Composite: +9.8% YTD
- S&P 500: +8.9% YTD
- DJIA: +8.5% YTD
Reviewing Friday’s data:
- June Housing Starts 1.427 mln (Briefing.com consensus 1.328 mln); Prior was revised to 1.199 mln from 1.177 mln, June Building Permits 1.367 mln (Briefing.com consensus 1.403 mln); Prior was revised to 1.410 mln from 1.413 mln. The key takeaway from the report is that there wasn’t any growth in single-unit starts or permits, which isn’t a positive read for a housing market pinched by affordability issues.
- June Import Prices 0.3%; Prior was revised to 1.7% from 1.9%
- June Import Prices ex-oil 0.4%; Prior was revised to 0.7% from 0.8%
- June Export Prices -0.6%; Prior was revised to 1.2% from 1.3%
- June Export Price ex-ag -0.7%; Prior 1.2%
- June Industrial Production 0.1% (Briefing.com consensus 0.3%); Prior 0.1%, June Capacity Utilization 76.1% (Briefing.com consensus 76.2%); Prior was revised to 76.1% from 76.2%. The key takeaway from the report is that there was no increase in manufacturing output, something that hasn’t happened since January.
- July Univ. of Michigan Consumer Sentiment – Prelim 54.4 (Briefing.com consensus 50.7); Prior 49.5. The key takeaway from the report was the correlation between lower gas prices and higher sentiment, the latter of which was pervasive across groups by age, wealth, income, and political party. Gas prices, though, have started to increase again with the military action between the U.S. and Iran, so it remains to be seen if this improved sentiment can be sustained.
This Week
S&P futures vs fair value: +14.00. Nasdaq futures vs fair value: +206.00.
Equity futures point to a higher open this morning as semiconductor stocks attract some buying after last week’s selloff, while easing oil prices provide support for the broader market.
Stocks are coming off a tough week in which climbing oil and intense selling across semiconductor stocks and other mega-cap tech names pushed the major averages to a firmly lower finish.
Large chipmakers are moving higher this morning, while memory names such as Micron (MU 892.55, +43.60, +5.1%) lead the advance after Bloomberg reported that Kimi K3, the latest model from Chinese company Moonshot AI that added to last week’s semiconductor volatility, requires a large amount of memory to operate. On a related note, Axios reported that the Trump administration could ban Chinese AI models.
Meanwhile, the market still largely expects negotiations to prevail between the U.S. and Iran despite the two sides exchanging fire. Crude oil is currently down $1.43 (-1.8%) to $80.35 per barrel.
Investors received just a couple of earnings reports this morning, though this week will see a considerable ramp-up in the number of companies reporting.
On the data front, the 10:00 a.m. ET release of the June leading Economic Index (Briefing.com consensus 0.1%) kicks off a light week of notable releases.
In corporate news:
- Apple(AAPL 50, -2.24, -0.7%) raises iPhone prices by 17% in Japan, according to Bloomberg.
- Domino’s Pizza (DPZ 00, +21.82, +6.8%) missed EPS expectations by $0.10, beat revenue expectations, and saw U.S. same store sales growth of 0.1%.
- SpaceX (SPCX83, +1.74, +1.4%) now sets a July 23 target for its next Starship launch, according to Reuters.
Reviewing overnight developments:
Equity indices in the Asia-Pacific region began the week on a mixed note with South Korea’s Kospi (-4.5%) closing at its lowest level since late April. Japan’s Nikkei: CLOSED, Hong Kong’s Hang Seng: +2.4%, China’s Shanghai Composite: +0.9%, India’s Sensex: -0.6%, South Korea’s Kospi: -4.5%, Australia’s ASX All Ordinaries: -0.1%.
In news:
- China Securities Regulatory Commission is reportedly aiming to stabilize the country’s equity market at a time when many listed companies are announcing dividends and share buybacks.
- The Trump administration is reportedly considering banning the use of Chinese AI models in the U.S.
- The People’s Bank of China left its one-year and five-year loan prime rates at their respective 3.00% and 3.50%.
- The approval rating for Japan’s Prime Minister Takaichi has fallen to a 2026 low of 53%.
In economic data: New Zealand’s June trade surplus NZD23 mln (expected surplus of NZD250 mln; last surplus of NZD577 mln)
Major European indices trade near their flat lines while sovereign debt is under some light pressure ahead of this week’s policy meeting at the European Central Bank, which is not expected to result in a rate hike. STOXX Europe 600: UNCH, Germany’s DAX: +0.2%, U.K.’s FTSE 100: -0.3%, France’s CAC 40: +0.3%, Italy’s FTSE MIB: +0.2%, Spain’s IBEX 35: UNCH.
In news:
- Andy Burnham will become the U.K.’s seventh prime minister since 2016 today.
- Discount carrier Ryanair reported a drop in Q1 profit due to lower demand and higher fuel costs.
In economic data:
- Eurozone’s May Construction Output 0.38% yr/yr (last 0.10%)
- Germany’s June PPI -0.3% m/m (expected -0.2%; last 0.3%); 1.8% yr/yr (last 0.1%)
- K.’s June Rightmove House Price Index -1.0% m/m (last -0.6%); -0.4% yr/yr (last -0.5%)
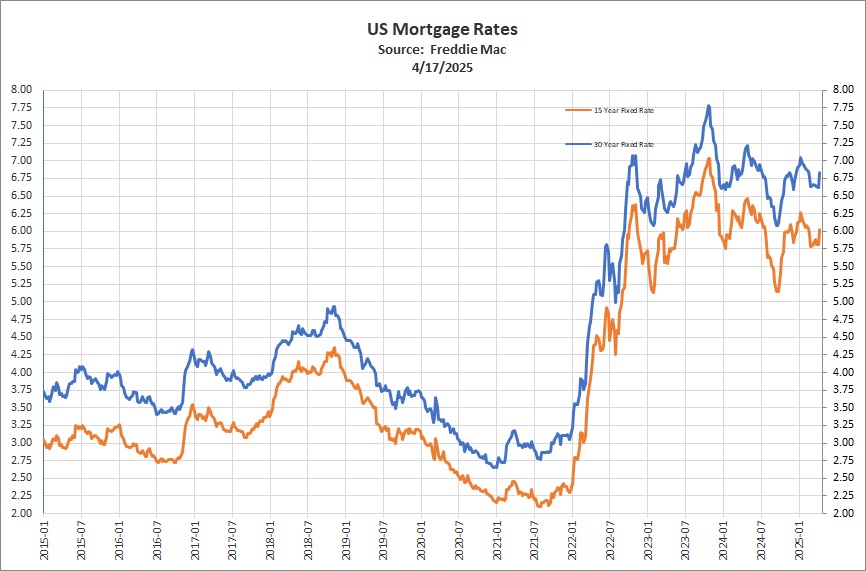
Mortgage Rates
“The 30-year fixed-rate mortgage averaged 6.55% this week,” said Sam Khater, Freddie Mac’s Chief Economist. “Purchase application demand has weakened recently, but housing affordability is more favorable and housing inventory continues to rise, thus the backdrop for prospective homebuyers is modestly improving.”
The 30-year FRM averaged 6.55% as of July 16, 2026, up from last week when it averaged 6.49%. A year ago at this time, the 30-year FRM averaged 6.75%.
The 15-year FRM averaged 5.93%, up from last week when it averaged 5.82%. A year ago at this time, the 15-year FRM averaged 5.92%.
Selected Cryptocurrencies
| Symbol | Name | Price | 24h % | 7d % | Market Cap | Volume(24h) |
| BTC | Bitcoin | $64,815.88 | 0.51% | 3.04% | $1.3T | $22B |
| ETH | Ethereum | $1,887.85 | 0.71% | 6.01% | $227.83B | $9.24B |
| BNB | BNB | $570.44 | 0.39% | 0.23% | $75.96B | $922.15M |
| XRP | XRP | $1.10 | 0.63% | 2.40% | $68.93B | $862.47M |
| SOL | Solana | $76.64 | 0.60% | 0.42% | $44.65B | $1.61B |
| TRX | TRON | $0.33 | -0.46% | -0.52% | $30.9B | $375.34M |
| HYPE | Hyperliquid | $60.98 | -0.37% | -6.45% | $15.42B | $238.98M |
| DOGE | Dogecoin | $0.07 | -0.16% | 0.23% | $11.24B | $430.16M |
| ZEC | Zcash | $534.25 | -3.90% | 3.72% | $8.96B | $399.93M |
| LEO | UNUS SED LEO | $9.67 | -1.36% | 1.65% | $8.9B | $298.4K |
| XLM | Stellar | $0.19 | -0.10% | 1.89% | $6.41B | $143.58M |
| XMR | Monero | $335.93 | -0.01% | 2.70% | $6.3B | $70.23M |
| LINK | Chainlink | $8.47 | 1.31% | 6.90% | $6.34B | $193.54M |
| ADA | Cardano | $0.16 | -0.27% | 3.20% | $6B | $226.63M |
| CC | Canton | $0.12 | -1.06% | -7.20% | $4.86B | $15M |
| BCH | Bitcoin Cash | $213.76 | -1.65% | -10.24% | $4.28B | $97.91M |
| USD1 | World Liberty Financial USD | $1.00 | -0.01% | 0.02% | $4.2B | $617.09M |
Data as of 4:40 AM PDT, Monday, July 20, 2026. Source: https://coinmarketcap.com
If you know someone age 62 or over who is feeling stressed financially and considering a reverse mortgage please send them this excellent piece with general information about reverse mortgages at: https://beaconrwa.com/reversemortgageguidebrwa/
Sources: Bill Roller, BR Capital, Inc. dba Beacon Rock Wealth Advisors American Association for Individual Investors (AAII), Associated Press, Barclays Capital, Bloomberg, Briefing.com, Citigroup, Deutsche Bank, FactSet, Financial Times, Goldman Sachs, JPMorgan Asset Management, MarketfieldAsset Management, Morgan Stanley, MSCI, Morningstar, Northern Trust, Oppenheimer Funds, PIMCO, Standard & Poor’s, StockCharts.com, The Conference Board, Thomson Reuters, T. Rowe Price, U.S. Bureau of Economic Analysis, U.S. Federal Reserve, Wall Street Journal, The Washington Post. Index performance is shown as total return, which includes dividends, with the exception of MSCI-EM, which is quoted as price return/excluding dividends. Performance for the MSCI-EAFE and MSCI-EM indexes is quoted in U.S. Dollar investor terms.
The information above has been obtained from sources considered reliable, but no representation is made as to its completeness, accuracy or timeliness. All information and opinions expressed are subject to change without notice. Information provided in this report is not intended to be, and should not be construed as, investment, legal or tax advice; and does not constitute an offer, or a solicitation of any offer, to buy or sell any security, investment or other product BR Capital, Inc. dba Beacon Rock Wealth Advisors is a registered investment advisor.
Notes key: (+) positive/encouraging development, (0) neutral/inconclusive/no net effect, (-) negative/discouraging development.