Your Weekly Update for Monday, February 3, 2020
Beacon Rock Wealth Advisors is a financial planning and registered investment advisory firm in Camas, Washington. We are always available to answer your finance questions. Give us a call at (800) 562-7096 or send an email to info@beaconrwa.com.
If you or someone you know is worried about retirement, send us and email or give us a call for a no-obligation Retirement and Social Security Analysis.
If you find this information useful, please forward this newsletter to a friend and ask them to subscribe at https://newsletters.beaconrwa.com/subscribe.
Have a great week!
Mike Elerath
CERTIFIED FINANCIAL PLANNERTM
CERTIFIED IN LONG-TERM CARE
NATIONAL SOCIAL SECURITY ADVISOR
Bill Roller
NMLS #107972
CHARTERED FINANCIAL ANALYST
CERTIFIED FINANCIAL PLANNERTM
CHARTERED MARKET TECHNICIAN
Summary
Markets were down last week on Coronavirus concerns. The Dow Jones Industrial Average fell 2.53% to 28,526.03. The S&P500 finished down 2.12% to 3,225.52, while the Nasdaq Composite finished down 1.76% to 9,150.94. The annual yield on the 30-year Treasury fell 11.3 basis points to 2.015%.
Economic news for the week included the Federal Reserve taking no action on interest rates, and GDP gaining nominally for the last quarter of 2019. Durable goods came in better than expected, tempered results were seen in housing and consumer confidence, while manufacturing weakened in the well-watched Chicago PMI survey.
Equities around the world lost ground during the week as uncertainties surrounding the new coronavirus put a damper on early-year positive sentiment. In keeping, high-quality bonds gained due to the reversal of flows. Commodities also suffered due to the unknown, but assumed negative economic growth impact.
Economic Notes
(0) The FOMC meeting resulted in no policy change, as expected, and as previously reported. Fed Chair Jerome Powell’s press conference afterward reemphasized the same theme of rates being in a good place and any policy action on hold for the time being. Interestingly, he also again discussed the Fed’s long-term view of inflation targeting as ‘asymmetric’. This essentially means that, in order to ensure the long-term target of 2% PCE inflation is achieved, they would be willing to let inflation run at a ‘fast’ pace for a time in order to offset the current ‘slow’ period.
Another area of focus by questioners was the Fed’s balance sheet, and directly, injections of a backstop of funds into short-term lending (‘repo’) markets. There have been some concerns of this infusion of cash being another form of quantitative easing meant to prop up a market with liquidity issues, since infusion represents nearly half of the amount the Fed unwound from their balance sheet beginning in late 2017.
However, the committee’s response (a sentiment which has been generally shared by many economists) is that the Fed has always been heavily involved with insuring ample liquidity in short-term bond markets, by buying and selling Treasury bills as needed, to keep the market rate within the desired target range. So, this can perhaps be seen as more of a flexible line of credit than a QE infusion. Levels may still remain high (at least $1.5 tril.), though, now that dynamics of these markets has changed due to the payment of interest to banks for their reserves held at the Fed, something they never used to do. Banks have a far simpler incentive—aside from tighter capital requirements since the financial crisis, they’re trying to earn the highest rates on spare cash they can get. This is true even if the amount is as little as 0.05% better, which can start to add up on large balances.
(+/0) The advance report for 4th quarter GDP came in at 2.1%, just beating the 2.0% expected by consensus as well as the 2.0% reading from Q3. Under the hood, personal consumption rose at a 1.8% rate, just under but close to expectations and showing deceleration. Business fixed investment also fell for the third time in a row, at -1.5%, with a drop in equipment offsetting a gain in intellectual property. Inventory investments declined, carving -1.1% off of total growth, while net exports added 1.5% to the figure with imports declining sharply along with China trade woes. In other areas, residential investment and government spending gained. Core PCE inflation for the quarter rose at a 1.3% annualized rate, which was below forecast by a few tenths, with the year-over-year rate at 1.6%—below the Fed’s target and reemphasizing their plans for boosting it.
Forecasts for Q1-2020 GDP are better, with the Atlanta Fed GDPNow at 2.7%, but the New York Fed GDP Nowcast significantly weaker at 1.7%. These, coupled with those compiled by Wall Street economists continue to remain somewhere in the 1.5-2.5% range, with an average of about 2.0%—unsurprisingly, in line with last quarter’s actual result.
(-) The Chicago PMI index for January fell by -6 points to 42.9, further into contraction, and its lowest level since December 2015. All key components saw a decline, including new orders, production, order backlogs, and inventories. Employment fell by a fraction of a point, and remained in contraction as well. Supplier deliveries ticked down a bit but remained one of the few expansionary bright spots in the report. Interestingly, one anecdotal question of the month was related to the potential impacts of the newly-signed USMCA trade agreement, with almost all respondents expecting little to no change in business plans as a result. The other related to expected growth overall, with about half expecting growth of 0-5% for the year, while the other half had expectations of above 5%, which was a bit surprising considering the weakness of sentiment elsewhere in the report.
(+) Durable goods orders for December rose 2.4% on a headline level, far surpassing expectations calling for a 0.3% gain. Core durable goods orders, on the other hand, declined by -0.9%, despite the median forecast expectation calling for a 0.2% gain. The substantial differential can be explained by a 90% rise in defense orders, which offset a nearly equivalent decline in orders for commercial aircraft. Core shipments fell by -0.4%, also bucking expectations of a 0.2% increase. One might not think a single manufacturer would make such a difference on the results, but the Boeing 737 Max is expensive, and usually bought in bulk, so the impact can trickle through.
(-) The advance goods trade balance report for December showed a sharp widening in the trade deficit by -$5.3 bil. to -$68.3 bil.—wider than the more tempered -$65.0 bil. deficit expected. Imports for goods rose by nearly $6 bil., concentrated in industrial supplies, which overwhelmed a minor increase for goods exports.
(0) Personal income for December rose by 0.2%, which fell a tenth short of expectations, up 4% on a year-over-year basis, with the wages component rising 5%. Personal spending, though, matched expectations by rising 0.3%. The brought the personal savings rate down by -0.2% to 7.6%, although year-over-year, spending is rose 5%, which is in line with 2017 for the strongest results in 13 years. The PCE inflation index rose a rounded 0.3% on a headline level and 0.2% for core, which brought the year-over-year figures to 1.6%.
(+) The S&P/Case-Shiller 20-city home price index for November showed a gain of 0.5%, which beat expectations calling for 0.4%. Prices rose in all 20 cities, led by near-percent gains in Charlotte, Boston, and Seattle. Year-over-year, the growth of the index reaccelerated by four-tenths to 2.6%. This remains lower than over the past year or two, but in keeping with a pace above that of inflation, which is in keeping with history.
(-) New home sales for December fell by -0.4% to a seasonally-adjusted annualized rate of 694k, below the 730k expected, in addition to revisions for prior months of nearly -30k. Interestingly, on a non-seasonally adjusted basis, sales came in at their highest December level in 13 years, which again points to some bright spots for housing. Regionally, the South experienced the most severe declines, while the West saw sharp gains. New home sales are up 23% on a year-over-year basis.
(-) Pending home sales in December fell by -4.9%, which bucked expectations calling for a 0.5% gain. It appeared that storm activity in the South region may have played a role in this negative result, with pending sales falling nearly -6% there, although all four regions fell by at least -3%. Year-over-year, the rate of change ticked up to 7%, however. Interestingly, the MBA mortgage purchase application index is also sharply higher.
(+) The Conference Board’s consumer confidence index for January rose by 3.4 points to 131.6, beating expectations calling for a reading of 128. Assessments of present economic conditions rose by nearly 5 points, which surpassed those for the future, which came in over 2 points higher. The labor differential, which measures the ease in finding employment, rose by almost 4 points back to near a high point for the current cycle.
(+) The Univ. of Michigan consumer sentiment survey rose by 0.7 of a point to 99.8 for January, beating expectations calling for an unchanged 99.1, and an improvement on the preliminary reading. Assessments of current conditions fell back a bit, while future expectations rose by a few points to lead the broader survey upward. Inflation expectations for the coming 5-10 years were unchanged from last month, at 2.5%.
(0/+) Initial jobless claims for the Jan. 25 ending week fell by -7k to 216k, just a bit above the median forecast of 215k. Continuing claims for the Jan. 18 week also fell, by -44k, to 1.703 mil., below consensus calling for 1.730 mil. There were no reported anomalies for the week, although the bulk of claims declines came from California. It’s possible that some residual seasonal issues are still baked into the reports, which tend to plague a variety of economic data for Q1 in recent years. Overall, employment markets appear to remain solid.
Question of the Week: What has been/will be the impact of the coronavirus on the global economy and markets?
The spread of the new coronavirus has taken over the headlines and hijacked market sentiment in recent weeks. Thus far, through available medical data, it appears that while the virus appears more contagious than the similar SARS epidemic in 2003, it is less lethal. The fatality rate for the coronavirus has been 3% or so thus far, relative to 9% for SARS at its peak.
The idiosyncratic elements included in such events—such as the World Health Organization declaring China’s surging infections a global public health emergency, the Russians closing their land border, and drastically reduced air travel—all added to market worries. The week ended with more questions about the level of contagion, and lethality, as a few hundred travelers from the Wuhan epicenter were quarantined in California, which is the first such domestic action in decades.
From an economic standpoint, it appears that the global economic growth pace could be reduced by as much as 0.5-1.5% for Q1, based on best estimates, if conditions peak and recover similar to past experience. In the worst case, this may lengthen the period of global growth slowdown experienced and defer a recovery into mid-year or a bit beyond, as opposed to earlier 2020. This growth impact mostly impacts China, due to reduced travel, but also a slowdown or stoppage of domestic consumption, including entertainment, such as restaurants and consumer goods. This could affect large multi-national brands, but also any company sensitive to general business conditions, as well as energy commodities.
In reviewing several previous episodes of epidemics, including SARS (2003), Swine flu (2009), Avian flu (2013), and Ebola (2014), financial markets reacted negatively in a similar way. On average, equities troughed about four weeks after the initial panic. In each of these cases, they recovered back to around where they started before the panic in the subsequent few weeks (and moved higher than that in several cases) by two months after the initial event. History doesn’t always repeat, and every contagion is a bit different, but such similar epidemics were proven to have been short-lived blips on the financial radar screen.
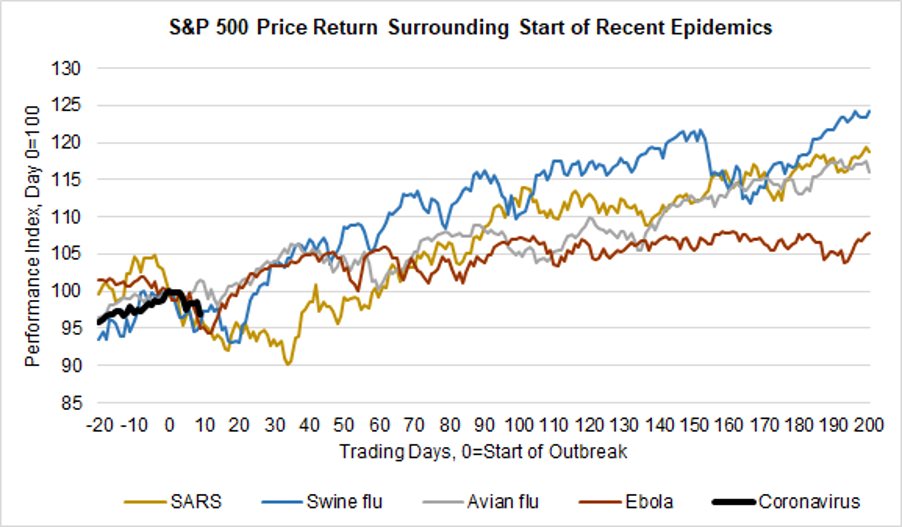
Source: FocusPoint Solutions calculations, based on index returns from Yahoo Finance. Epidemic start dates: SARS (1/21/03), Swine flu (6/11/09), Avian flu (3/31/13), Ebola (9/30/14), as defined by Goldman Sachs Investment Research. Coronavirus start date set as 1/17/20, with returns through 1/31/20.
Market Notes
| Period ending 1/31/2020 | 1 Week (%) | YTD (%) |
| DJIA | -2.52 | -0.89 |
| S&P 500 | -2.10 | -0.04 |
| Russell 2000 | -2.89 | -3.21 |
| MSCI-EAFE | -2.50 | -2.09 |
| MSCI-EM | -5.10 | -4.69 |
| BBgBarc U.S. Aggregate | 0.62 | 1.92 |
| U.S. Treasury Yields | 3 Mo. | 2 Yr. | 5 Yr. | 10 Yr. | 30 Yr. |
| 12/31/2019 | 1.55 | 1.58 | 1.69 | 1.92 | 2.39 |
| 1/24/2020 | 1.54 | 1.49 | 1.51 | 1.70 | 2.14 |
| 1/31/2020 | 1.55 | 1.33 | 1.32 | 1.51 | 1.99 |
U.S. stocks continued to suffer last week due almost exclusively to uncertainty surrounding the spread of the coronavirus from China, which is discussed more extensively above. By sector, energy and materials fared the worst, due to their perceived economic sensitivity to macro growth, while utilities served as the only sector with a positive return, other than consumer discretionary. A few mega-cap stocks, namely Apple and Microsoft, reported decent earnings last week, which helped buoy sentiment a bit away from the virus.
Foreign stocks fared slightly worse than domestic, due to stronger potential global trade effects from the virus. Brexit was finalized on Jan. 31, by both the U.K. and Europe, while the ‘transition’ status to create a new set of trade agreements is set to end by the end of the year. Additionally, the eurozone economy came in showing meager growth of 0.1% for Q4 and 1.0% for 2019 as a whole—continuing the recent trend.
Stock markets in China remained closed for the Lunar New Year, although no doubt these would have been affected the global panic about the virus, as evidenced by offshore markets down -5%. Other Asian markets in the geographic proximity, such as Korea, Indonesia, and Taiwan lost over -5% for the week. Commodity-sensitive nations, such as Russia and Brazil also lost similar ground.
U.S. bonds fared well with investors fleeing equity risk in all segments. Treasuries of longer duration led, as expected, although investment-grade corporates also earned positive returns. High yield and floating rate bank loans lagged, losing ground for the week. The treasury curve re-inverted, with the rates at the belly of the curve plummeted in the 5-year area, although 10-year yields also declined to just over 1.5% to end the month. Foreign developed market debt gained, along with its safe haven status, while emerging market local bonds lost well over a percent, despite a weaker dollar.
Commodities fell significantly across the board, with the exception of safe haven precious metals, along with virus fears expected to cut global economic growth. The price of crude oil dropped by over 5% to under $52/barrel, and industrial metals fared nearly as poorly due to their economic sensitivity. The lack of travel and overall demand from China, a much larger consumer of petroleum than in decades past, such as during the SARS epidemic, could exacerbate the current supply glut—keeping pressure on energy prices.
Mortgage Rates
“This week’s mortgage rates were the second lowest in three years, supporting homebuyer demand and leading to higher refinancing activity,” said Sam Khater, Freddie Mac’s Chief Economist. “Borrowers who take advantage of these low rates can improve their cash flow by lowering their monthly mortgage payments, giving them more money to spend or save.”
The 30-year fixed-rate mortgage averaged 3.51% with an average 0.7 point for the week ending January 30, 2020, down from last week when it averaged 3.60%. A year ago at this time, the 30-year FRM averaged 4.46%.
The 15-year fixed-rate mortgage averaged 3.00% with an average 0.7 point, down from last week when it averaged 3.04%. A year ago at this time, the 15-year FRM averaged 3.89%.
The 5-year Treasury-indexed hybrid adjustable-rate mortgage (ARM) averaged 3.24% with an average 0.3 point, down from last week when it averaged 3.28%. A year ago at this time, the 5-year ARM averaged 3.96%.
Average commitment rates should be reported along with average fees and points to reflect the total upfront cost of obtaining the mortgage. Visit the following link for the Definitions. Borrowers may still pay closing costs which are not included in the survey.

Through our relationship with Prestige Home Mortgage in Vancouver, Washington we originate residential and reverse mortgages. Check us out at https://beaconrwa.com and our affiliated websites at https://reverse-mortgages.us and https://socialsecurityquestionsanswered4u.com.
Sources: Ryan Long, CFA, FocusPoint Solutions, American Association for Individual Investors (AAII), Associated Press, Barclays Capital, Bloomberg, Citigroup, Deutsche Bank, FactSet, Financial Times, Goldman Sachs, JPMorgan Asset Management, Marketfield Asset Management, Morgan Stanley, MSCI, Morningstar, Northern Trust, Oppenheimer Funds, PIMCO, Standard & Poor’s, StockCharts.com, The Conference Board, Thomson Reuters, T. Rowe Price, U.S. Bureau of Economic Analysis, U.S. Federal Reserve, Wall Street Journal, The Washington Post. Index performance is shown as total return, which includes dividends, with the exception of MSCI-EM, which is quoted as price return/excluding dividends. Performance for the MSCI-EAFE and MSCI-EM indexes is quoted in U.S. Dollar investor terms.
The information above has been obtained from sources considered reliable, but no representation is made as to its completeness, accuracy or timeliness. All information and opinions expressed are subject to change without notice. Information provided in this report is not intended to be, and should not be construed as, investment, legal or tax advice; and does not constitute an offer, or a solicitation of any offer, to buy or sell any security, investment or other product. FocusPoint Solutions, Inc. is a registered investment advisor.
Notes key: (+) positive/encouraging development, (0) neutral/inconclusive/no net effect, (-) negative/discouraging development.