Your Weekly Update for Monday, February 4, 2019
Beacon Rock Wealth Advisors is a financial planning and registered investment advisory firm in Camas, Washington. Through our relationship with Prestige Home Mortgage in Vancouver, Washington we originate residential and reverse mortgages. Check us out at https://beaconrrwa.com and our affiliated websites at https://reverse-mortgages.us and https://socialsecurityquestionsanswered4u.com. We are always available to answer your finance questions. Give us a call at (800) 562-7096 or send an email to info@beaconrwa.com.
If you find this information useful, please forward this newsletter to a friend and ask them to subscribe at https://newsletters.beaconrwa.com/subscribe.
Have a great week!
Mike Elerath, NSSA
Bill Roller, CFA, CFP®
NMLS #107972
Mortgage Rates
Sam Khater, Freddie Mac’s chief economist, says, “Purchase applications were down this week after soaring early in the year. However, softening house price appreciation along with increasing inventory of homes on the market – and historically low mortgage rates – should give a boost to the spring homebuying season.”
The 30-year fixed-rate mortgage (FRM) averaged 4.46% with an average 0.5 point for the week ending January 31, 2019, up from last week when it averaged 4.45%. A year ago at this time, the 30-year FRM averaged 4.22%.
The 15-year FRM this week averaged 3.89% with an average 0.4 point, up from last week when it averaged 3.88%. A year ago at this time, the 15-year FRM averaged 3.68%.
The 5-year Treasury-indexed hybrid adjustable-rate mortgage (ARM) averaged 3.96% with an average 0.3 point, up from last week when it averaged 3.90%. A year ago at this time, the 5-year ARM averaged 3.53%.
Average commitment rates should be reported along with average fees and points to reflect the total upfront cost of obtaining the mortgage. Borrowers may still pay closing costs which are not included in the survey.

Summary
Markets were up for the week. The Dow Jones Industrial Average ended up 1.3% to 25063.89, the S&P500 up 1.6% to 2706.53, and the Nasdaq Composite up 1.4% to 7263.87. The annual yield on the 30-Year Treasury fell 2 basis points to 3.03%.
Economic data for the week included no change in the Federal Reserve’s policy interest rate, and more mixed results from housing, while positive results originated from ISM manufacturing data and labor markets, particularly the employment situation for January.
U.S. equity markets gained for the week, with foreign equities just behind. Bonds eked out a minor gain as interest rates declined along the yield curve. Commodities rose a bit upon a further recovery in crude oil prices.
Economic Notes
(0) As noted earlier in the week, the FOMC kept rates steady, although the communication tone has quickly evolved. This change was noted right away in both Chair Powell’s press conference and reflections from various economists after the meeting. Specifically, the insertion of the word ‘patient’ ratified the assumed feeling that global economic data prior to the meeting was sufficiently weak enough to warrant a pause in the previously described ‘autopilot’ contractionary interest rate hike policy. In keeping with status quo, inflation was described as muted, while employment strength was acknowledged. These offsetting forces point to a balanced policy outlook and lack of urgency in action—over time, we will see which factors outweigh the others in terms of driving policy ultimately.
(+) The ISM manufacturing index for January rose by 2.3 points to 56.6, surpassing expectations calling for a slight drop to 54.0. In looking at the underlying sub-segments, new orders and production both gained, as did inventories, while employment and supplier deliveries fell back slightly. However, all segments were solidly in growth territory, with several approaching levels near 60 (anything over 50 signifies expansion). Prices paid, however, did decline significantly, into contractionary territory, along with lower prices for crude oil.
(+) Construction spending rose 0.8% in November, which surpassed expectations of a 0.2% increase; however, prior months were revised down from earlier reports—although all are now a bit stale dated to due to the delays in release. However, spending is almost 5% higher than a year ago. Within the November monthly numbers, private residential construction rose several percent, to lead the overall figure, while all other segments, especially, public residential construction, declined.
(+) New home sales for November (delayed due to the government shutdown) came in sharply higher, by 16.9%, to a seasonally-adjusted annualized rate of 657k, an eight-month high, and beating expectations calling for a more meager rise to 570k. This was in addition to upward revisions for prior months and may have been influenced by a rebound from Hurricane Michael, with the Southern region showing the strongest magnitude of gains. Other regions were also higher to a lesser degree, other than the West, which lost ground for the month. However, sales remained -8% lower than the year prior.
(-) Pending home sales for December fell by -2.2%, which ran counter to an expected 0.5% increase for the month. While states in the West region experienced gains of 2%, the South and Northeast each fell by several percent to pull down the national result. Year-over-year, the rate of pending sales fell further to -10%, which was the sharpest drop in about five years. While ‘pending’ is only a precursor to ‘existing’ (finalized) home sales, so is of somewhat limited use, the declines are meaningful as another indication of housing market softness.
(0/-) The Case-Shiller home price index for November showed a gain of 0.3%, which was a tenth of a percent below expectations. For the single month, three-quarters of the 20 cities saw gains, led by increases of nearly a percent in New York and Atlanta, while San Francisco and Seattle prices fell by about a half-percent. Year-over-year, the index continued to show growth, but at a decelerated pace of 4.7%, which was nearly a half-percent below that of the prior month, and on a steady downward trend as home price gains normalize/flatten (year-over-year increases were at almost 7% a year ago).
(-) The Conference Board index of consumer confidence survey for January experienced a decline of -6.4 points to 120.2, falling beyond the lesser expected drop to 124.0. This represented an 18-month low for the series, and was led by a minor decline in assessments of present conditions but more sharply by a -10 point drop in future expectations. The labor differential, however, which measures difficulty in finding employment, ticked up to levels near the peak for this cycle. It’s possible the negativity surrounding the recent government shutdown could have played a role in the downturn for this index, which can be sensitive to headline news events.
(+) The final Univ. of Michigan consumer sentiment index for January showed an increase of 0.5 of a point from the earlier report to 91.2, surpassing the 90.7 level expected. Assessments of current conditions declined by just over a point while future expectations rose by over a point for the period. Inflation expectations for the coming 5-10 years were flat at 2.6%.
(+) The ADP private sector employment report for January showed a gain of 213k, which far surpassed estimates of 181k expected by consensus. Service sector jobs were up by 145k, including strong showings in professional/business and education/health. Goods-producing jobs were up 68k, with construction additions surpassing those in manufacturing. While the connection between the ADP report and government jobs report on Friday are not always in lockstep, this was a solid contribution and reiterates healthy labor market conditions.
(-) Initial jobless claims for the Jan. 26 ending week rose by 53k to 253k, surpassing the 215k level expected. Continuing claims for the Jan. 19 week rose to 1.782 mil., which surpassed the 1.721 mil. level expected. The MLK holiday and/or school holidays may have interfered, but overall levels remain extremely low.
(+) The government employment situation report for January came in better than expected, though the details were a bit convoluted due to the federal government shutdown last month, which affected a large number of workers. Therefore, while decent enough, last month’s report may not be as useful as some.
Growth of nonfarm payrolls came in at a strong 304k, surpassing the 165k gain expected. It appears that milder weather effects may have played a role in up to 100k jobs, considering the composition was solid in the leisure/hospitality, retail and construction sectors. However, the December report was revised down sharply, from the initial 300k-plus to 222k. Services jobs rose by 224k, led by education/healthcare up 55k, business services rising at a more tempered pace of 30k, while information jobs declined by -4k (each possibly a byproduct of the shutdown, in the contract work segment). Manufacturing jobs were up by 13k, in addition to gains in mining/logging ositions. January is a time for annual recalibrations in the measurement formula, in addition to seasonal adjustments, which tend to be more dramatic during the winter months, which raises the chances for shorter-term noise. It’s possible the strength from more benign weather last month could well be undone by the severe conditions felt across the nation currently, if such late winter weather persists. This is another time for a good reminder that the standard error for these payroll reports is +/- 100k, which is highly significant statistically. Regardless, markets appear to care most about the headline number at the time it’s released.
Moving away from month-to-month growth to a longer-term trend perspective, total seasonally-adjusted payroll growth on a year-over-year basis continues to look solid compared to that 12 months prior, per the 5-year chart below.
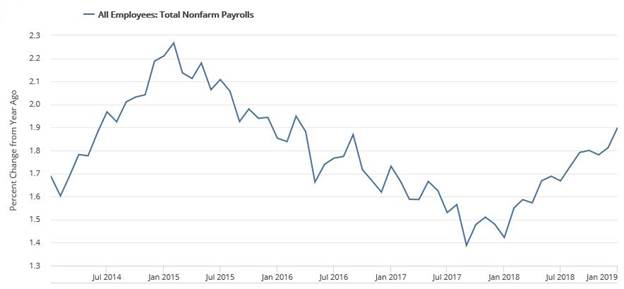
Source: Federal Reserve of St. Louis, Bureau of Labor Statistics
The unemployment rate, interestingly, rose just over a tenth to 4.0%, in contrast to expectations for no change, as labor force participation increased by a tenth of a percent. This also affected the U-6 underemployment measure, which rose by a half-percent to 8.1%, with a sharp increase in part-time work for economic reasons (likely shutdown-related). The household survey component showed a drop of -251k jobs—the difference between this and the headline payrolls number appears to be shutdown-related, in terms of who’s being asked, and how being ‘employed’ is classified, in addition to recent methodological adjustments.
Average hourly earnings only rose 0.1% for the month, which was a few ticks below the 0.3% pace expected, although data for prior months was revised higher. Year-over-year earnings were up 3.2%, which was a slightly slower pace than December. Average weekly hours worked were unchanged at 34.5. The employment cost index for Q4 showed an increase of 0.7%, a bit lower than expected, bringing the total comp increase for the past year to 2.9%.
Market Notes
| Period ending 2/1/2019 | 1 Week (%) | YTD (%) |
| DJIA | 1.33 | 7.57 |
| S&P 500 | 1.62 | 8.13 |
| Russell 2000 | 1.31 | 11.45 |
| MSCI-EAFE | 0.94 | 6.51 |
| MSCI-EM | 1.73 | 8.74 |
| BBgBarc U.S. Aggregate | 0.53 | 0.81 |
| U.S. Treasury Yields | 3 Mo. | 2 Yr. | 5 Yr. | 10 Yr. | 30 Yr. |
| 12/31/2018 | 2.45 | 2.48 | 2.51 | 2.69 | 3.02 |
| 1/25/2019 | 2.39 | 2.60 | 2.59 | 2.76 | 3.06 |
| 2/1/2019 | 2.40 | 2.52 | 2.51 | 2.70 | 3.03 |
U.S. stocks rose last week on the heels of a more ‘dovish’-than-expected Fed, decent economic data and earnings results. Mid-week, stocks spiked in response to the dovish Fed language that was hoped for, but not entirely expected, in terms of an acknowledgment of global economic slowing. The fear was that the Fed would steamroll through their process of raising rates as initially planned without regard for extraneous factors; however, careful language assuaged markets.
By sector, several sectors ended at or near gains of 3%, including energy and communications services, based on earnings results (the latter led by those from Facebook); financials and consumer discretionary brought up the rear with barely-positive gains (the latter of that group led by Amazon).
Last week was the most substantial in terms of Q4 S&P earnings releases, with over a third of the index reporting. Nearly half of reporting is now in, with 70% of firms surprising on the upside (not abnormal, due to the usual quarterly tendency of firms to keep forecasts on the conservative side). The earnings growth rate for the quarter was just over 12%, in line with estimates. By sector, results were led by far better than expected earnings (over 95% growth) from the energy sector, based on oil revenues from earlier in the year, while most other groups performed in a far tighter range of 5-15% growth; the sole exception was utilities, which experienced negative growth due to a handful of company-specific factors. Revenues have grown in the mid-6% range for the quarter. Overall, this has brought the forward-looking price/earnings valuation of the S&P to 15.7x—fairly close to long-term averages. However, for Q1 2019, a decline in earnings year-over-year is expected, while full year 2019 results are anticipated to fall in the 5-6% range. As expected, growth across the board has decelerated from far stronger levels earlier in 2018.
Foreign stocks also saw gains for the week, albeit to a lesser degree than in the U.S. European and Japanese stocks generally rose in line with domestic equities, while those in the U.K. rose several percent along with discussion of potentially additional negotiations with the EU on key points of Brexit, including the critical (on several levels) item of the Ireland-Northern Ireland border. Italy, however, declined as it was reported that their economy slipped into recessionin Q4, the second straight (slightly) negative economic growth quarter; Europe overall has been growing at its weakest pace in several years. Again, emerging markets outperformed domestic markets, led by Chinese and peripheral Asian stocks, with a rising tide of hope that a trade deal with the U.S. will soon be worked out.
U.S. bonds ticked higher slightly, as rates generally fell across the intermediate- to longer-part of the yield curve. Investment-grade corporates outperformed governments and high yield slightly, while high yield and bank loans hold the lead year-to-date with strong recoveries from the depths of December (helped by decent earnings performance from the energy sector). The week ended with another interesting minor inversion between the 1 year and 5 year treasury rates, before turning positively sloped again beyond the 5 year. What does this mean? Consensus is calling for a slowdown in rate hikes or even a possible recession over the next few years (to no surprise for anyone reading headlines over the past few months). However, these are never obvious, and can reverse, so minor inversions like this could either correct themselves or turn into a full yield curve inversion, which would be much more telling as a signal, based on historical precedent.
Foreign bonds in developed markets rose in keeping with domestic bonds, but were outgained by another recovery week in emerging market debt for the week, as well as year-to-date, for both local-currency and dollar-denominated bonds.
Real estate fared especially well last week, with gains in the low single-digits, thanks to decent economic reports coupled with a more dovish Fed, that would keep interest rates contained—this type of environment has tended to be a ‘sweet spot’ for real estate investments. Foreign REITs fared just a bit behind U.S. real estate.
Commodities gained on the week, as higher prices for precious metals and crude oil offset a -10% drop in natural gas, following changes in inventory expectations and extreme winter weather letting up somewhat. The price of crude oil ticked up again by about 3% to just over $55/barrel as economic prospects improved, the number of rigs in operation declined, and uncertainty continued in Venezuela due to just-imposed U.S. sanctions on exports.
Sources: Ryan M. Long, CFA, FocusPoint Solutions, American Association for Individual Investors (AAII), Associated Press, Barclays Capital, Bloomberg, Citigroup, Deutsche Bank, FactSet, Financial Times, FRED Economic Research, Freddie Mac, Goldman Sachs, JPMorgan Asset Management, Marketfield Asset Management, Morgan Stanley, MSCI, Morningstar, Northern Trust, Oppenheimer Funds, PIMCO, Standard & Poor’s, StockCharts.com, The Conference Board, Thomson Reuters, U.S. Bureau of Economic Analysis, U.S. Federal Reserve, Wall Street Journal, The Washington Post. Index performance is shown as total return, which includes dividends, with the exception of MSCI-EM, which is quoted as price return/excluding dividends. Performance for the MSCI-EAFE and MSCI-EM indexes is quoted in U.S. Dollar investor terms.
The information above has been obtained from sources considered reliable, but no representation is made as to its completeness, accuracy or timeliness. All information and opinions expressed are subject to change without notice. Information provided in this report is not intended to be, and should not be construed as, investment, legal or tax advice; and does not constitute an offer, or a solicitation of any offer, to buy or sell any security, investment or other product. Residential and reverse mortgages are offered through Prestige Home Mortgage in Vancouver, WA.
Notes key: (+) positive/encouraging development, (0) neutral/inconclusive/no net effect, (-) negative/discouraging development.