 Get the pdf version: Investor Insights & Outlook August 2015
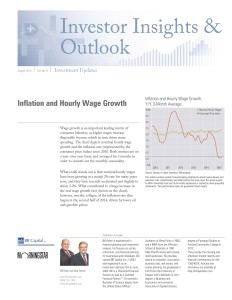
Inflation and Hourly Wage Growth
Wage growth is an important leading metric of consumer behavior, as higher wages increase disposable income, which in turn drives more spending. The chart depicts nominal hourly wage growth and the inflation rate (represented by the consumer price index) since 2010. Both metrics are on a year-over-year basis, and averaged for 3 months in order to smooth out the monthly seasonality.
What really stands out is that nominal hourly wages have been growing at a steady 2% rate for many years now, and they have recently accelerated just slightly to about 2.2%. What contributed to a huge increase in the real wage growth (not shown on the chart), however, was the collapse of the inflation rate that began in the second half of 2014, driven by lower oil and gasoline prices.
Monthly Market Commentary
Majority of the needle-moving economic indicators over the past month were roughly in line with expectations, and the chances of an interest rate increase at the next Fed meeting remain high. Nonetheless, the interest rate hike is not a done deal, and the potential of a bad economic report, such as low August employment numbers, could delay the Fed’s move.
Employment: According to the BLS the economy added 215,000 jobs in July, close to the consensus estimate of 220,000 jobs. The pace was a bit off of the 249,000-per-month average of the past 12 months, which Morningstar economists never viewed as sustainable. Two barn-burner months at the very end of 2014, especially the 423,000 jobs added in November, are still having a dramatic impact on the averages. Also, the revisions to the prior two months were minimal. After a big drop in June, the unemployment rate remained steady at 5.3% even as the labor force increased by more than 100,000 people.
This headline data should be enough to keep the Fed on pace to raise interest rates in 2015, most likely as early as September given that the employment market looks healthy and inflation is moving slowly toward the Fed target. However, the July data, which is relatively stable with small seasonal adjustment factors, was never really our worry in terms of derailing the Fed. It is the August report, which will be the last report to come out before the Fed’s September meeting, that remains the last major impediment for a September rate hike. The August jobs report has been a very rough one over the past several years. This has been especially true for the first version of the August labor report, with subsequent revisions eventually eliminating some of the shortfalls. One recent report actually showed a job loss on the first cut and just last year the originally reported August data was below 100,000 jobs. If this August’s job report shows 150,000 or fewer jobs added, the Fed may choose to delay action at its September meeting. Again, it seems extremely likely that rates will be increased in 2015, but the exact meeting date at which it happens is largely irrelevant to the longer-term outlook for the economy.
GDP: Headline GDP growth rate for the second quarter on a sequential, annualized basis increased a modest 2.3% versus expectations of an increase of 2.8% and Morningstar economists’ forecast of 3.0%. The metric also ran below the long-term average of 3.1%. However, the goal posts were moved substantially, as the first quarter now showed growth of 0.6% instead of shrinkage of 0.2%, a rather substantial swing of 0.8%. Adding that 0.8% revision to the reported growth rate of 2.3% produces 3.1%, which seems more like an apples-to-apples comparison. So the second quarter wasn’t the disappointment that some commentators are making it out to be. In addition, it was a relatively clean quarter with minuscule and offsetting adjustments for inventory and net exports. These two categories have often wreaked havoc on the interpretation of the GDP reports in many recent quarters. For example, falling exports and rising imports deducted almost 2% from the first-quarter GDP report.
China: After moving sharply higher over the past several years, the Chinese government devalued its currency by 1.8%, which is just a drop in the proverbial bucket. If it did one of these each week for the next five, then we might be more concerned. Nevertheless, it is recognition that Chinese growth is not nearly as robust as the government had hoped. And that weakness is not great news for other emerging-market trading partners or commodity producers. Meanwhile, the U.S., which receives just 1% or so of its GDP from sales to China, stands to benefit from cheap commodities more than it will be hurt by weak sales to China. Also, because China has kept such tight control over foreign investment, financial dislocation in China will not reverberate around the world financial markets in the way that U.S. subprime mortgages did.
Four Retirement-Portfolio Withdrawal Mistakes to Avoid
Some errors in retirement-portfolio planning fall into the category of minor infractions rather than major missteps. Did you downplay foreign stocks versus standard asset-allocation advice? It’s probably not going to have a big impact on whether your money lasts throughout your retirement years.
But withdrawal rate errors can have more serious repercussions for retirement-portfolios. If you take too much out of your portfolio at the outset of retirement, and that coincides with a difficult market environment –you can deal your portfolio a blow from which it may never recover. Other retirees may take far less than they actually could, all in the name of safety. The risk is that they didn’t fully enjoy enough of their money during their lifetimes.
Mistake 1: Not Adjusting With Your Portfolio’s Value and Market Conditions. Even though the popular “4% rule” assumes a static annual-dollar-withdrawal amount, adjusted for inflation, retirees would be better off staying flexible with their withdrawals.
What to Do Instead: The simplest way to tether your withdrawal rate to your portfolio’s performance is to withdraw a fixed percentage, versus a fixed dollar amount adjusted for inflation, year in and year out. That’s intuitively appealing, but this approach may lead to more radical swings in spending than is desirable for many retirees. It’s possible to find a more comfortable middle ground by using a fixed percentage rate as a baseline but bounding those withdrawals with a “ceiling” and “floor.”
Mistake 2: Not Adjusting With Your Time Horizon. Taking a fixed amount from a portfolio also neglects the fact that, as you age, you can safely take more from your portfolio than you could when you were younger. The original “4%” research assumed a 30-year time horizon, but retirees with shorter time horizons (life expectancies) of 10 to 15 years can reasonably take higher amounts.
What to Do Instead: To help factor in the role of life expectancy retirees can use the IRS’ tables for required minimum distributions as a starting point to inform their withdrawal rates. That said, those distribution rates may be too high for people who believe their life expectancy will be longer than average.
Mistake 3: Not Adjusting Based on Your Portfolio Mix. Many retirees take withdrawal-rate guidance, such as the 4% guideline, and run with it, without stopping to assess whether their situations fit with the profile underpinning that guidance. The 4% guideline assumed a retiree had a balanced stock/bond portfolio. But retirees with more-conservative portfolios should use a more-conservative (lower) figure, whereas those with more-aggressive asset allocations might reasonably take a higher amount.
What to Do Instead: Be sure to customize your withdrawal rate based on your own factors, including your portfolio mix.
Mistake 4: Not Factoring In the Role of Taxes. The money you’ve saved in tax-deferred retirement-savings vehicles might look comfortingly plump. However, it’s important to factor in taxes when determining your take-home withdrawals from those accounts. A 4% withdrawal from an $800,000 portfolio is $32,000, but that amount shrivels to just $24,000, assuming a 25% tax hit.
What to Do Instead: It pays to be conservative in your planning assumptions. To be safe it’s valuable to assume a higher tax rate than you might actually end up paying.
Disclosure: This is for informational purposes only and should not be considered tax or financial planning advice. Please consult with a financial or tax professional for advice specific to your situation. This article contributed by Christine Benz, Director of Personal Finance with Morningstar.
Housing Construction in Good Shape
The chart depicts the state of the housing construction industry, suggesting that there is still plenty of room to grow in this slow, but steady recovery we’ve seen so far. The latest starts and permits data from the Census Bureau, however, shows a slightly exaggerated picture, as it is the multi-family category that’s been making overall housing construction look better than it is in reality. Both starts and permits picked up in June, as multi-family activity rose sharply amid expiring construction tax incentives for developers in the New York City area. As a result, the housing construction revival is probably not as strong as the numbers seem to currently suggest. Nonetheless, improvements for single-family construction still look healthy, and continue to trend up closer to the 10% rate year over year.
©2013 Morningstar, Inc. All Rights Reserved. The information contained herein (1) is intended solely for informational purposes; (2) is proprietary to Morningstar and/or the content providers; (3) is not warranted to be accurate, complete, or timely; and (4) does not constitute investment advice of any kind. Neither Morningstar nor the content providers are responsible for any damages or losses arising from any use of this information. Past performance is no guarantee of future results. “Morningstar” and the Morningstar logo are registered trademarks of Morningstar, Inc. Morningstar Market Commentary originally published by Robert Johnson, CFA, Director of Economic Analysis with Morningstar and has been modified for Morningstar Newsletter Builder.