 Get the pdf version: Investor Insights & Outlook February 2015
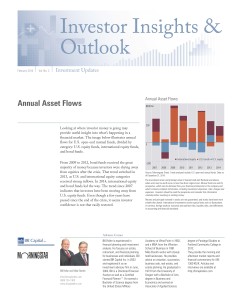
Annual Asset Flows
Looking at where investor money is going may provide useful insight into what’s happening in a financial market. The image below illustrates annual flows for U.S. open-end mutual funds, divided by category: U.S. equity funds, international equity funds, and bond funds.
From 2009 to 2012, bond funds received the great majority of money because investors were shying away from equities after the crisis. That trend switched in 2013, as U.S. and international equity categories received strong inflows. In 2014, international equity and bond funds led the way. The trend since 2007 indicates that investors have been moving away from U.S. equity funds. Even though a few years have passed since the end of the crisis, it seems investor confidence is not that easily restored.
Monthly Market Commentary
Even though it’s always a guessing game, investor fears appear to have changed recently. They’ve shifted from the timing of a Fed interest rate hike and an overheated U.S. economy to slumping economic growth rates.
GDP: The halving of the GDP growth rate from 5% in the third quarter to 2.6% in the fourth quarter was a real dose of cold water. In many circumstances, a 2.6% rate would be something to celebrate. However, following growth of 4.6% and 5.0% in the previous two quarters, there is some worry on the Street that
the economy is slowing. Morningstar economists still believe that the U.S. remains well within its trend line growth rate of 2.0%–2.5%, which is virtually unchanged over the past four years.
Employment: The most recent employment report probably surprised even the more bullish forecasters. The U.S. economy added 257,000 new jobs in January, showing that the fourth-quarter jobs momentum has continued into 2015. Upward revisions were applied to the data, particularly to the November and December numbers—revised up by 70,000 and 77,000 more jobs, respectively. The data now show that there were 752,000 jobs created in those two months alone, and 423,000 new jobs created in November, which is the best single-month result since March 2000. At the same time, looking at 2014 overall, the revisions amounted to only 164,000 more jobs, which by historical standards is not a drastic annual revision.
Year-over-year, three-month average employment growth continues to accelerate. Total nonfarm employment growth now stands at 2.2%–2.3%, while much better performing private-sector employment growth increased to 2.6%. It’s not clear yet whether January’s bullish employment data is a spillover from the high growth in the second and third quarters or actual proof of a further accelerating U.S. economy.
Consumption and Income: Given consumption is 70% of U.S. GDP, it is one of the more critical factors for detecting the direction of the economy. The income data helps determine if changing spending levels happened because of changing attitudes or lack of
ability to spend more.
Month to month, consumption numbers have been on a yo-yo, up 0.7% in November then down 0.1% in December. An unusually cold November followed by a warm December (shifting the timing of seasonal purchases and utility usage) may be responsible for the most recent bout of volatility. In addition, it is very hard to get the seasonal factors exactly right this time of year, further enhancing the already volatile sector data.
The more reliable year-over-year, averaged data shows a consistent pattern of modest acceleration in consumption growth and nicely accelerating growth in both wages and real disposable income. The data, at least at this moment, suggest that consumers are not spending all of their income gains yet again. Currently, wages are growing at a 3.5% annual rate, real disposable income at 3.1%, and consumption slightly lower at 2.8%. The high level of wage growth suggests that there is at least some potential for consumption to improve further in the months ahead.
Trade: The November to December data showed the trade deficit increased from $39.8 billion to $46.5 billion. Exports were down 0.8% and imports jumped 2.2%. That’s not a totally shocking state of affairs, given that the U.S. economy is relatively strong and the rest of the world is slowing.
Pessimists are characterizing the trade report as the worst monthly deficit since 2012. And they will go on to say that the strong dollar can only make things worse and the U.S. competitive position has eroded badly. However, both the month-to-month category data and the year-over-year data suggest that things
aren’t so bad, and that changing oil markets are behind a lot of the apparent deterioration.
Why Cheap Fund Shares May Not Be a Bargain
Some investors make the mistake of treating a mutual fund’s share price the way they would a stock’s share price, but they’re actually quite different. When considering two mutual funds of comparable quality, choosing the one with the cheapest share price may not be the best way to go.
A stock’s share price represents the market value of one small slice of equity in a company. If the company appears to be growing, demand for its shares may increase because investors expect its earnings (and, thus, its dividends) to grow and/or because they think they will later be able to sell the shares at a higher price. This increased demand for the shares drives the share price higher. If demand decreases–perhaps due to a lousy earnings report or a product recall–its share price is likely to fall.
In contrast, a mutual fund’s share price is determined not by market demand for the shares themselves but rather by the value of the fund’s underlying holdings. This is expressed as the fund’s net asset value, or NAV, meaning the value of all its holdings and cash after expenses are paid divided by the number of shares outstanding. (Also, investors can own fractional shares of mutual funds—something they can’t do with stocks.)
To illustrate, let’s say that the holdings in a fund’s portfolio are worth a combined total of $1 billion after fund expenses are paid, and that the fund has 10 million shares outstanding. Therefore, the net asset value of each of those shares is $100, or $1 billion divided by 10 million. But what if another fund of comparable quality has a share price of just $75? That’s a much better deal, right?
Not necessarily. Remember that a fund’s share price is determined in part by the number of shares outstanding. So, the lower share price may have nothing to do with the quality of the fund’s holdings and everything to do with the fact that it simply has issued more shares. As an example, let’s say that Fund A has a NAV of
$20 per share with 100 million shares outstanding and Fund B has a NAV of $15 per share with 200 million shares outstanding. This means that Fund A’s holdings collectively are worth $2 billion (after fund expenses are taken into account) while Fund B’s holdings are worth a combined $3 billion. (The fund’s net asset value also includes the value of any capital gains or dividends received by the fund until they are distributed to shareholders. This is why a fund’s NAV typically drops once those distributions are made.)
But the larger point is that it doesn’t really matter what a fund’s share price is, other than for record- keeping and tax purposes to compute gains and losses. What matters in terms of performance is the change in price on a percentage basis. A fund with a NAV of $5 per share that sees its holdings perform well enough to lift its NAV to $6 per share has effectively provided its investors with a return of 20%. But a fund with a NAV of $20 per share that increases to $21 per share has provided a much lower return of just 5%. Again, it’s not the absolute price of the mutual fund’s shares that matters to investors but rather the percentage change in that price.
Returns and principal invested in stocks are not guaranteed. Investing does not ensure a profitable outcome and always involves risk of loss. The investment return and principal value of mutual funds will fluctuate and shares, when sold, may be worth more or less than their original cost. Mutual funds are sold by prospectus, which can be obtained from your financial professional or the company and which contains complete information, including investment objectives, risks, charges and expenses. Investors should read the prospectus and consider this information carefully before investing or sending money.
Home Price Growth Returning to a More Sustainable Rate
It is certain that, after a series of fast-paced increases that peaked in late 2013, the rate of home price increases is moderating. As of November, the Case- Shiller Index is showing that home prices are growing at 4.3% year-over-year, which is a much slower rate compared to nearly a 14% pace reported in 2013. The prices recovered about 82% of the previous high, and 14 states are currently either above or close to the previous 2006 peak. Nonetheless, Nevada, Florida, Arizona, and a few other states still remain 20% or more below the peak, and it will certainly take many years for those prices to return to their pre-recession level. On the positive side, slower-growing prices are good news for prospective buyers and for the health of the housing market in general, as they should improve housing affordability, providing an essential boost to this so far anemic housing recovery.
©2013 Morningstar, Inc. All Rights Reserved. The information contained herein (1) is intended solely for informational purposes; (2) is proprietary to Morningstar and/or the content providers; (3) is not warranted to be accurate, complete, or timely; and (4) does not constitute investment advice of any kind. Neither Morningstar nor the content providers are responsible for any damages or losses arising from any use of this information. Past performance is no guarantee of future results. “Morningstar” and the Morningstar logo are registered trademarks of Morningstar, Inc. Morningstar Market Commentary originally published by Robert Johnson, CFA, Director of Economic Analysis with Morningstar and has been modified for Morningstar Newsletter Builder.