 Get the pdf version: Investor Insights & Outlook October 2013
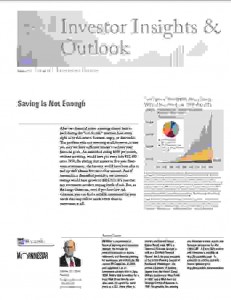
Saving Is Not Enough
After two financial crises occurring almost back to back during the “lost decade,” investors have every right to be risk-averse, hesitant, angry, or distrustful. The problem with not investing at all, however, is that you may not have sufficient money to achieve your financial goals. An individual saving $100 per month, without investing, would have put away only $52,400 since 1970. By placing that money in five-year fixed- term investments, the investor would have been able to end up with almost five times that amount. And if invested in a diversified portfolio, our investor’s savings would have grown to $835,313. It’s true that any investment involves varying levels of risk. But, as the image illustrates, even if you have low risk tolerance, you can find a suitable investment for your needs that may still be much better than no investment at all.
The True Costs of ETFs
Investors often make the mistake of assuming the expense ratio of a fund represents the total expenses incurred when investing in that fund. This isn’t true for mutual funds and it certainly isn’t true for exchange -traded funds (ETFs). There are four main costs to owning an ETF.
The net expense ratio is the percentage of assets used to pay for operating expenses, management fees, administrative fees, and other costs incurred by the ETF, except brokerage costs. Assuming a gain of $500 on a principal investment of $10,000, an expense ratio of 0.09% will incur a cost of $9.45. Investors have to pay the expense ratio regardless of whether the fund realized a gain or a loss.
Trading commissions are what brokers will charge you to execute a buy or sell transaction. For frequent traders, these costs can quickly add up. Some brokers may offer commission-free online trading.
Premiums/Discounts represent the difference between an ETF’s market price (price at which the ETF is trading on the exchange) and net asset value (value of all the ETF’s assets divided by the total number of shares). While not an out-of-pocket cost, nobody likes to overpay on a purchase. When buying an ETF trading at a premium, the investor is paying more than the fund is actually worth. The same consideration applies when an investor is selling an ETF; selling an ETF at a discount will shortchange an investor. If an ETF is trading at a 20-cent premium per share, the investor will overpay by $20 for a 100 shares buy transaction. If the ETF trades at a 20-cent discount per share when sold, the investor will be shortchanged of $20 for the sell transaction.
Bid/ask spreads are the difference between the price the buyer is willing to pay (bid) and the price for which the seller is willing to sell (ask). A wider spread will incur more costs for the investor when the ETF is bought or sold. For cost calculations, let’s assume the buyer and seller meet in the middle and share the costs equally. For an ETF with a $0.10 spread, the buyer would incur a cost of $0.05 cents per share ($5 for a 100 shares transaction). Assuming the spread is still
$0.10 when the ETF is sold, an additional $5 selling cost would be incurred. Again, while not an out-of- pocket cost, bid/ask spreads can affect the value the investor pays or receives.
It is important to understand, while expense ratios are a good place to start when considering the cost of an ETF, they are not a true indicator of the total cost.
Holding an exchange-traded fund does not ensure a profitable outcome and all investing involves risk, including the loss of the entire principal. Since each ETF is different, investors should read the prospectus and consider this information carefully before investing. The prospectus can be obtained from your financial professional or the ETF provider and contains complete information, including investment objectives, risks, charges and expenses. ETF risks include, but are not limited to, market risk, market trading risk, liquidity risk, imperfect benchmark correlation, leverage, and any other risk associated with the underlying securities. There is no guarantee that any fund will achieve its investment objective. In
addition to ETF expenses, brokerage costs apply. Fees are charged regardless of profitability and may result in depletion of assets. The market price of ETFs traded on the secondary market is subject to the forces of supply and demand and thus independent of the NAV. This can result in the market price trading at a premium or discount to the NAV which will affect an investor’s value. The market prices of ETF’s can fluctuate as a result of several factors, such as security- specific factors or general investor sentiment. Therefore, investors should be aware of the prospect of market fluctuations and the impact it may have on the market price. ETF trading may be halted due to market conditions, impacting an investor’s ability to sell the ETF.
Monthly Market Commentary
News in recent weeks has been all about the government shutdown and the even more worrisome prospect of violating the debt ceiling sometime later this month. A debt-ceiling violation could lead to the deadly combination of higher interest rates and a slower economy. In a world where markets swoon on a 20,000-job miss in monthly employment data (on monthly job growth of about 200,000), losing 800,000 government jobs in one shot is a very big deal. Although the market has been soft lately, it seems to have hardly grasped the potential of a longer-term shutdown. We have reached this crisis point so many times recently with no negative consequences that the market seems almost numbed to the potential pain.
Relatively inflexible wage rates and the propensity of most consumers to keep spending despite short-term adversity all contribute to the economy’s overall stability and slow growth rate. But a month-long government shutdown would likely cut GDP growth by at least 0.5% in a world of 2.0% growth.
Employment: Another negative consequence of the shutdown is that government agencies have stopped releasing statistics; the Bureau of Labor Statistics’ official employment report is missing. The ADP employment report showed more of the slow, unsatisfying growth rates seen for the last several months, with private sector jobs growing by 166,000, up from the 159,000 jobs added in August. The report was a bit of a disappointment, as the consensus estimate was for 180,000 jobs to be added.
Housing: New home sales and housing starts slowed down in the face of higher rates, while existing home sales jumped ahead as homebuyers raced to close quickly before rates moved even higher. Even before the higher rates, housing data had begun to top out as land and labor shortages slowed home construction. This has caused many analysts to scale back their housing growth rate and GDP contribution for both 2013 and 2014.
Consumer spending: Month-to-month consumption data has shown improvement, but the much more reliable year-over-year data suggests more of the same for consumption and the United States economy. Year -over-year three-month averaged consumption growth remained stuck in its slow and unsatisfying rut of 1.9% when adjusted for inflation. That remains well ahead of income growth of just 1.1%, with the higher payroll and income tax rates subtracting close to a full
percentage point off of income growth. Income data is beginning to show some improvements that might help fourth-quarter spending data, but initial reports seem to suggest a softer holiday shopping season than last year.
Quarter-end insights: While the overall U.S. economy has been quite stable, the third quarter did bring a number of real surprises, some positive and some negative. In the positive camp, Europe appeared to move from recession into recovery. The U.S., Chinese, and European manufacturing economies appeared to pick up steam in the quarter. Better auto sales and production helped the data, as did some inventory rebuilding and general improvements in consumption from more confident European consumers.
On the negative side, U.S. interest rates continued to climb throughout most of the quarter. The U.S. 10- year Treasury bond approached 3% in the middle of September before settling back a little after the Federal Reserve decided not to taper bond purchases. However, despite this decision, rates are still substantially higher than they were a quarter ago and are unlikely to approach old lows. Although tapering is off the table for another month, it will happen at some point, and the market knows it. Morningstar economists expect the 10-year Treasury bond to reach the 3% to 4% range over the next year or so, and a tapering program of some type to begin in the next three or four months. Projections for the remainder of the year include GDP growth in the 2.00% to 2.25% range, inflation at 1.60% to 1.80%, and the unemployment rate at 7.10%.
The Risks of Over-Allocated Funds
Exposure to concentrated investments may increase the overall risk of a portfolio. As a rule of thumb, if a fund holds more than 30% of assets in one sector, you may be putting all those eggs in one basket. Take, for example, the dot-com bubble. Investors who loaded up on rapidly growing Internet investments probably lost a considerable amount of money when the bubble burst.
It is also important to consider the extent a fund is vested in its top investments. For example, if 25% of its assets are in the top three holdings, or a fund consists of 40 or fewer holdings, the fund could be a higher risk. Funds with investments concentrated in one country can be a risky proposition as well. A fund manager not only must pick good investments but also runs the risk of a souring economy. Country-specific risks become even more prominent when a fund involves investments in emerging markets. These economies are generally subject to a variety of risks that can drive holdings southbound.
Concentrated investing is not for the casual or risk- averse. You can be exposed to substantially greater losses than those in the overall market, so be sure to evaluate a fund’s holdings to determine the level of risk inherent when investing.
Keep in mind that diversification does not eliminate the risk of experiencing investment losses. International investments involve special risks such as fluctuations in currency, foreign taxation, economic and political risks, and differences in accounting and financial standards. Keep in mind that concentrated investments are narrowly focused investments that typically exhibit higher volatility than the market in general. These investments will fluctuate with current market conditions and may be worth more or less than the original cost upon liquidation.
©2013 Morningstar, Inc. All Rights Reserved. The information contained herein (1) is intended solely for informational purposes; (2) is proprietary to Morningstar and/or the content providers; (3) is not warranted to be accurate, complete, or timely; and (4) does not constitute investment advice of any kind. Neither Morningstar nor the content providers are responsible for any damages or losses arising from any use of this information. Past performance is no guarantee of future results. “Morningstar” and the Morningstar logo are registered trademarks of Morningstar, Inc. Morningstar Market. Commentary originally published by Robert Johnson, CFA, Director of Economic Analysis with Morningstar and has been modified for Morningstar Newsletter Builder.