
Your Weekly Update for Monday, August 31, 2026.
Beacon Rock Wealth Advisors is a dba of BR Capital, Inc. It is a financial planning and registered investment advisory firm in Camas, Washington. We are always available to answer your questions. Give us a call at (360) 735-1900 or send an email.
If you or someone you know is worried about retirement, send us an email or give us a call for a no-obligation Retirement and Social Security Analysis.
If this information is helpful to you, please forward this to a friend and ask them to subscribe at https://newsletters.beaconrwa.com/subscribe.
Have a great week!
Bill Roller
NMLS #107972
CHARTERED FINANCIAL ANALYST
CERTIFIED FINANCIAL PLANNERTM
CHARTERED MARKET TECHNICIAN
Summary
Markets were UP SLIGHTLY last week. The Dow Jones Industrial Average was UP 0.53% to 53,559.99 while the S&P500 ended UP 0.49% to 7,711.76. The Nasdaq Composite ROSE 0.85% to 26,402.42. The annual yield on the 30-year Treasury FELL 7.0 basis point(s) to 5.206%.
Last Week
Stocks retreat as rate-hike odds jump
The major averages finished a choppy Friday modestly lower, with the S&P 500 (-0.3%) and Nasdaq Composite (-0.5%) declining while the DJIA ended near its flatline. The market saw relatively little movement during the afternoon after an eventful morning shaped by Fed Chair Kevin Warsh’s Jackson Hole address, rising Treasury yields, and a sharp retreat in semiconductor stocks. Despite today’s losses, all three major averages secured gains for the week.
Warsh’s remarks were the main driver of the session. The Fed Chair emphasized that inflation remains above the central bank’s 2% target and said price stability should be its predominant focus at this point. His comments prompted a significant repricing of near-term policy expectations, with the probability of a 25-basis-point rate hike at the September FOMC meeting rising sharply to 57.5% from 35.4% yesterday.
Treasury yields climbed in response, with the pressure particularly pronounced at the shorter end of the curve. The move weighed more heavily on smaller stocks, leaving the Russell 2000 (-1.4%) and S&P Mid Cap 400 (-1.2%) with considerably wider losses than the major averages.
The major averages initially took the hawkish policy shift in stride, rallying to session highs during the morning behind strength in non-semiconductor mega-cap stocks. Those gains moderated as the session progressed, but remained enough to lift the consumer discretionary (+1.7%) and communication services (+1.6%) sectors to the top of the sector standings behind solid gains in Amazon (AMZN 266.43, +10.17, +3.97%) and Alphabet (GOOG 342.88, +5.17, +1.53%) .
Apple (AAPL 319.70, +5.12, +1.63%) and Microsoft (MSFT 513.53, +8.47, +1.68%) also advanced, providing some support for the major averages despite weakness elsewhere in the information technology sector (-1.3%).
Semiconductor stocks were the largest source of pressure, sending the PHLX Semiconductor Index down 3.5%. NVIDIA (NVDA 217.48, -10.50, -4.61%) gave back a sizable portion of yesterday’s post-earnings surge, while Marvell (MRVL 216.62, -24.83, -10.28%) was a notable laggard following its quarterly report.
Software stocks also surrendered some of yesterday’s earnings-driven gains, although the selling was considerably less pronounced. The iShares Expanded Tech-Software Sector ETF declined 0.7%, with Workday (WDAY 204.72, +11.15, +5.76%) standing out on the upside following its earnings report.
Six S&P 500 sectors ultimately finished lower. In addition to the information technology sector, the utilities (-1.1%) and industrials (-1.0%) sectors were among the main laggards.
While the financial sector (+0.3%) notched a modest gain, PayPal (PYPL 53.66, -7.81, -12.71%) finished as the worst-performing S&P 500 component after Bloomberg reported that the Advent/Stripe consortium abandoned its planned leveraged buyout valued at more than $50 billion, although the companies could resume discussions at a later date.
Ultimately, Fed Chair Warsh’s Jackson Hole address set the tone for Friday’s session, driving a hawkish repricing of September policy expectations and pushing Treasury yields higher, particularly at the shorter end of the curve. Strength in several non-semiconductor mega-cap stocks helped limit the damage at the headline-index level, but weakness in semiconductors and smaller stocks left the broader market under pressure. Even so, the major averages held onto enough of their earlier weekly gains to finish the week in positive territory.
U.S. Treasuries had a rough finish to the week with yields on 3-year and 5-year note yields hitting fresh highs for the year while the long bond outperformed but could not secure a higher finish. The 2-year note yield settled up 12 basis points to 4.35% (+12 basis points this week), and the 10-year note yield settled up five bais points to 4.72% (-2 basis points this week).
- Russell 2000: +19.8% YTD
- S&P Mid Cap 400: +14.4% YTD
- Nasdaq Composite: +13.6% YTD
- S&P 500: +12.7% YTD
- DJIA: +11.4% YTD
Reviewing today’s data:
- August Chicago PMI 47.1 (Briefing.com consensus 57.0); Prior 57.6
- August Univ. of Michigan Consumer Sentiment – Final 51.7 (Briefing.com consensus 51.0); Prior 51.0. The key takeaway from the report is that persistent inflation concerns are undercutting consumer sentiment.
This Week
S&P futures vs fair value: -28.00. Nasdaq futures vs fair value: -50.00.
Equity futures are pointing to a modestly lower open as investors monitor the latest geopolitical developments amid a fairly quiet morning of corporate news.
Crude oil is moving higher this morning following an uptick in hostilities between the U.S. and Iran, with Axios reporting that the U.S. struck launchers that were preparing to deploy mines in the Strait of Hormuz. Iran fired missiles at a U.S. base in Jordan in retaliation, and crude oil is currently up $2.97 (+3.6%) to $86.39 per barrel.
Stocks are coming off a winning week, with the major averages supported by strength in technology stocks after NVIDIA (NVDA 218.76, +1.21, +0.6%) and a host of software names delivered impressive earnings.
There are no U.S. economic releases scheduled today. However, the August Employment Report looms on Friday, with the market eager to see whether the data will once again reshape monetary policy expectations following Fed Chair Kevin Warsh’s somewhat hawkish tone at last week’s Jackson Hole Symposium.
In corporate news:
- President Trump to discuss high fuel prices with oil refiners this week, according to Bloomberg.
- Science Applications (SAIC77, +10.81, +8.58%) beat fiscal second-quarter earnings and revenue expectations and raised its fiscal 2027 guidance.
- GDEV (GDEV56, +0.69, +6.35%) launched a cash self-tender offer for up to $20 million of its ordinary shares.
- IperionX (IPX93, +0.92, +4.38%) received a second U.S. Army task order under its existing contract supporting domestic titanium production.
Reviewing overnight developments: Asia-Pacific markets ended the session mixed as China’s August business surveys remained in contraction territory. Japan’s Nikkei: -0.1%, Hong Kong’s Hang Seng: -0.1%, China’s Shanghai Composite: +0.9%, India’s Sensex: -0.4%, South Korea’s Kospi: +0.5%, Australia’s ASX All Ordinaries: -0.3%.
In news:
- The Reserve Bank of New Zealand will release its latest policy statement on Wednesday.
- The approval rating of Japan Prime Minister Takaichi’s cabinet remained at 53%, according to an Asahi poll.
In economic data:
- China’s August Manufacturing PMI 49.8 (expected 49.5; last 49.2) and Non-Manufacturing PMI 49.0 (expected 49.5; last 49.0)
- Japan’s July Retail Sales 4.0% yr/yr (expected 3.2%; last 0.6%). July Housing Starts 8.2% yr/yr (expected 7.2%; last 18.6%) and Construction Orders -13.4% yr/yr (last 2.3%)
- South Korea’s July Retail Sales -2.4% m/m (last 2.7%) and July Service Sector Output -1.3% m/m (last 0.7%). July Industrial Production 0.2% m/m (last 6.7%); 3.6% yr/yr (last 6.0%)
- Hong Kong’s July Retail Sales 4.5% yr/yr (last 4.6%)
- Australia’s Q2 Company Gross Operating Profits 1.8% qtr/qtr (expected 2.0%: last -1.5%) and Pre-tax Profits 12.5% qtr/qtr (last -4.1%). July Private Sector Credit 0.6% m/m (expected 0.7%; last 0.8%) and Housing Credit 0.5% m/m (last 0.6%). August MI Inflation Gauge 0.5% m/m (last 1.0%)
- New Zealand’s August ANZ Business Confidence 53.7 (last 56.1)
- India’s Q1 GDP 7.8% yr/yr (expected 7.1%; last 7.8%)
Major European markets are mixed while the U.K. market is closed for a bank holiday. STOXX Europe 600: -0.1%, Germany’s DAX: -0.7%, France’s CAC 40: +0.2%, Italy’s FTSE MIB: +0.4%, Spain’s IBEX 35: +0.2%.
In news:
- Fitch affirmed France’s A+ rating with a stable outlook.
- Iceland voted against reopening accession talks with the European Union.
In economic data: Spain’s June Current Account surplus EUR2.41 bln (last surplus of EUR1.84 bln)
Mortgage Rates
“Mortgage rates changed little this week averaging 6.66%,” said Sam Khater, Freddie Mac’s Chief Economist. “The economy remains resilient, demonstrated by steady consumer spending and rising household incomes. More homes coming on the market and slower price growth in many areas are giving buyers better options and helping create a more balanced housing market.”
The 30-year FRM averaged 6.66% as of August 27, 2026, slightly up from last week when it averaged 6.65%. A year ago at this time, the 30-year FRM averaged 6.56%.
The 15-year FRM averaged 5.98%, up from last week when it averaged 5.95%. A year ago at this time, the 15-year FRM averaged 5.69%.
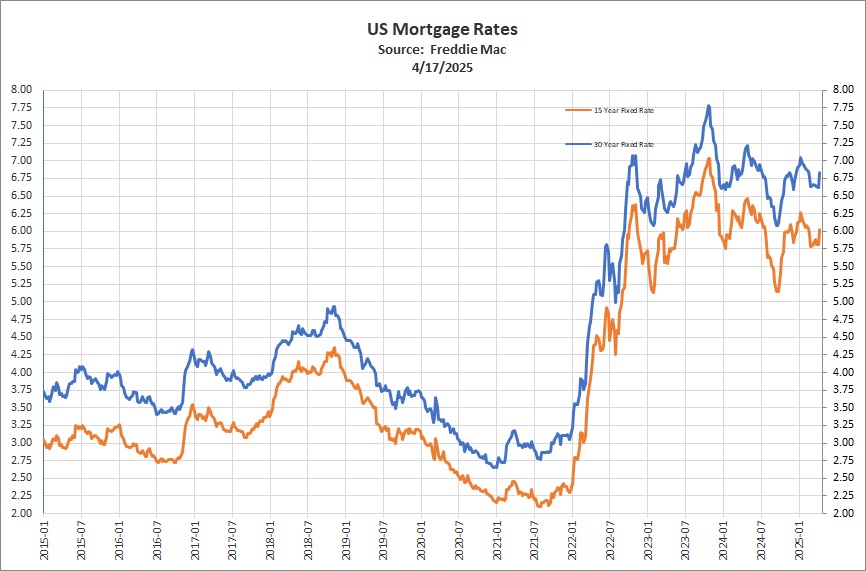
Freddie Mac’s Primary Mortgage Market Survey® is focused on conventional, conforming, fully amortizing home purchase loans for borrowers who put 20% down and have excellent credit. Average commitment rates should be reported along with average fees and points to reflect the total upfront cost of obtaining the mortgage. Borrowers may still pay closing costs which are not included in the survey.
Through our relationship with Mortgage Window, Inc. (NMLS 2485156) in Vancouver Washington we originate residential and reverse mortgages.
If you know someone age 62 or over who is feeling stressed financially and considering a reverse mortgage please send them this excellent piece with general information about reverse mortgages at: https://beaconrwa.com/reversemortgageguidebrwa/
Selected Cryptocurrencies
| Symbol | Name | Price | 24h % | 7d % | Market Cap | Volume(24h) |
| BTC | Bitcoin | $78,498.34 | 0.28% | 0.35% | $1.57T | $28.04B |
| ETH | Ethereum | $2,455.45 | -0.32% | -1.25% | $296.32B | $16.19B |
| BNB | BNB | $687.86 | -0.77% | -2.04% | $91.59B | $1.34B |
| XRP | XRP | $1.37 | -1.41% | -8.09% | $86.17B | $2.76B |
| SOL | Solana | $103.57 | -1.50% | 8.43% | $60.6B | $3.73B |
| TRX | TRON | $0.33 | -1.81% | -2.76% | $31.75B | $546.75M |
| HYPE | Hyperliquid | $81.85 | -2.07% | 2.54% | $20.6B | $909.25M |
| DOGE | Dogecoin | $0.08 | -2.61% | -10.01% | $14.18B | $787.98M |
| ZEC | Zcash | $841.58 | 0.23% | -0.31% | $14.17B | $1.25B |
| XMR | Monero | $539.56 | 12.74% | 27.81% | $10.14B | $257.25M |
| LEO | UNUS SED LEO | $9.62 | 1.05% | 2.91% | $8.85B | $178.43K |
| LINK | Chainlink | $11.26 | -1.33% | -3.61% | $8.42B | $330.11M |
| ADA | Cardano | $0.20 | -2.20% | -11.63% | $7.22B | $412.79M |
| XLM | Stellar | $0.18 | -1.62% | -10.93% | $6.13B | $128.77M |
| BCH | Bitcoin Cash | $246.93 | 0.12% | -9.73% | $4.95B | $138.18M |
| CC | Canton | $0.12 | 1.18% | -5.69% | $4.72B | $18.51M |
| USD1 | World Liberty Financial USD | $1.00 | 0.00% | -0.02% | $4.17B | $1.24B |
Data as of 5:00 AM PDT, Monday, August 31, 2026. Source: https://coinmarketcap.com
Sources: Bill Roller, BR Capital, Inc. dba Beacon Rock Wealth Advisors American Association for Individual Investors (AAII), Associated Press, Barclays Capital, Bloomberg, Briefing.com, Citigroup, Deutsche Bank, FactSet, Financial Times, Goldman Sachs, JPMorgan Asset Management, MarketfieldAsset Management, Morgan Stanley, MSCI, Morningstar, Northern Trust, Oppenheimer Funds, PIMCO, Standard & Poor’s, StockCharts.com, The Conference Board, Thomson Reuters, T. Rowe Price, U.S. Bureau of Economic Analysis, U.S. Federal Reserve, Wall Street Journal, The Washington Post. Index performance is shown as total return, which includes dividends, with the exception of MSCI-EM, which is quoted as price return/excluding dividends. Performance for the MSCI-EAFE and MSCI-EM indexes is quoted in U.S. Dollar investor terms.
The information above has been obtained from sources considered reliable, but no representation is made as to its completeness, accuracy or timeliness. All information and opinions expressed are subject to change without notice. Information provided in this report is not intended to be, and should not be construed as, investment, legal or tax advice; and does not constitute an offer, or a solicitation of any offer, to buy or sell any security, investment or other product BR Capital, Inc. dba Beacon Rock Wealth Advisors is a registered investment advisor.