
Your Weekly Update for Monday, August 10, 2026.
Beacon Rock Wealth Advisors is a dba of BR Capital, Inc. It is a financial planning and registered investment advisory firm in Camas, Washington. We are always available to answer your questions. Give us a call at (360) 735-1900 or send an email.
If you or someone you know is worried about retirement, send us an email or give us a call for a no-obligation Retirement and Social Security Analysis.
If this information is helpful to you, please forward this to a friend and ask them to subscribe at https://newsletters.beaconrwa.com/subscribe.
Have a great week!
Bill Roller
NMLS #107972
CHARTERED FINANCIAL ANALYST
CERTIFIED FINANCIAL PLANNERTM
CHARTERED MARKET TECHNICIAN
bill.roller@beaconrwa.com
Summary
Markets were UP last week. The Dow Jones Industrial Average was UP 2.96% to 54,036.93 while the S&P500 ended UP 3.58% to 7,757.64. The Nasdaq Composite ROSE 5.19% to 26,690.62. The annual yield on the 30-year Treasury FELL 6.4 basis point(s) to 5.211%.
Last Week
Stocks climb as softer jobs data tempers Fed expectations
Stocks finished the week on a positive note Friday as a softer-than-expected July employment report eased concerns about additional Federal Reserve tightening and renewed buying across growth-oriented and other rate-sensitive areas of the market. The S&P 500 gained 0.6% to notch a record closing high, the Nasdaq Composite climbed 1.3%, and the DJIA advanced 0.3%, leaving each major average with a weekly gain of at least 3.0%. The Russell 2000 (+1.1%) and S&P MidCap 400 (+1.3%) also turned in strong performances.
The July employment report provided the day’s primary catalyst, showing no payroll growth during the month alongside a sizable downward revision to June. The softer labor-market picture prompted investors to dial back expectations for additional Fed tightening and sent Treasury yields lower. According to the CME FedWatch tool, the probability of a 25-basis point rate increase at the September FOMC meeting fell to 41.9% from 55.0% on Thursday, while the probability of at least one rate hike by October dropped to 57.3% from 71.0%. That shift in expectations provided a meaningful tailwind for growth-oriented and other interest-sensitive areas of the market.
Technology was a major beneficiary of the friendlier rate backdrop. The information technology sector (+1.3%) finished among the market’s leaders as the PHLX Semiconductor Index climbed 2.6%, extending this week’s rebound. Software stocks also enjoyed another strong session, lifting the iShares GS Software ETF (IGV) 3.3%. Cloudflare (NET 300.27, +15.84, +5.57%) rallied following its earnings report, while Palantir Technologies (PLTR 172.01, +16.09, +10.32%) added to its impressive gains from earlier in the week. Datadog (DDOG 233.93, +4.64, +2.02%) and AppLovin (APP 346.80, +11.13, +3.32%) also recovered a portion of Thursday’s sharp post-earnings losses.
Strength extended well beyond technology. The consumer discretionary sector (+1.3%) benefited from a solid gain in Tesla (TSLA 328.58, +9.05, +2.83%), a strong post-earnings reaction in Airbnb (ABNB 178.07, +26.43, +17.43%), and buying interest across homebuilders and other rate-sensitive industries.
The materials sector (+1.5%) also outperformed as Newmont Corporation (NEM 112.98, +7.55, +7.16%) surged alongside a rebound in precious metals prices.
Mega-cap stocks remained an important source of support, with the Vanguard Mega Cap Growth ETF rising 0.9%. SpaceX (SPCX 133.11, +18.19, +15.83%) also posted a strong rebound, recovering much of its post-earnings decline from earlier this week. At the same time, solid gains in the Russell 2000 and S&P MidCap 400 underscored that Friday’s advance extended well beyond the market’s largest companies.
There were still a few notable pockets of weakness. The communication services sector (-0.4%) finished lower as The Trade Desk (TTD 13.80, -3.87, -21.90%) remained under heavy pressure following its earnings report, while Alphabet (GOOG 353.47, -3.15, -0.88%) extended its recent weakness after reports earlier this week of several senior AI departures.
The energy sector (-1.2%) was the day’s primary laggard despite another increase in crude oil prices. WTI crude futures settled $0.92 higher (+1.2%) at $78.19 per barrel, though prices retreated after the close following reports that Oman and Iran are making progress toward an agreement to reopen the Strait of Hormuz.
The financials sector (-0.3%) rounded out the three S&P 500 sectors that finished lower.
Friday’s advance capped an impressive week for equities, with a softer labor-market report complementing an already strong earnings backdrop. The resulting decline in Fed tightening expectations makes next week’s July Consumer Price Index particularly important, as investors look for confirmation that inflation is easing enough to keep policymakers on hold.
U.S. Treasuries climbed on Friday, extending this week’s rebound off July lows with unexpected help from a disappointing Employment Situation report for July. The 2-year note yield settled down five basis points to 4.20% (-9 basis points this week), and the 10-year note yield settled down two basis points to 4.65% (-10 basis points this week).
- Russell 2000: +22.3% YTD
- S&P Mid Cap 400: +17.6% YTD
- Nasdaq Composite: +14.8% YTD
- S&P 500: +13.3% YTD
- DJIA: +12.4% YTD
Reviewing Friday’s data:
- The July employment report falls into the domain of “bad news is good news.” Participants are recognizing that nonfarm payroll growth was weak (actually, there was no growth), that wage inflation disinflated, and that the labor force participation rate continues to dwindle. The key takeaway from the report is that it was soft enough, presumably, to keep Fed officials in a wait-and-see mode, such that they could see a better case now for not raising the target range for the fed funds rate at the September FOMC meeting.
- Consumer credit increased by $14.2 bln in June (Briefing.com consensus $9.0 bln) following a downwardly revised $1.1 billion decline (from -$0.2 billion) in May.
This Week
S&P futures vs fair value: -8.00. Nasdaq futures vs fair value: +5.00.
Equity futures point to a flattish opening amid a relatively quiet morning for the stock market. There are no economic data releases on the calendar, and this week’s slate of earnings releases is just a fraction of the previous several weeks.
Q2 earnings season has largely exceeded expectations, with strong results (particularly across some mega-cap tech names) contributing to the most recent run to record highs. Last week was especially productive for equities, with the major averages all finishing with weekly gains of 3% or wider and the S&P 500 and DJIA notching record highs throughout the week.
This week’s primary catalyst comes in the form of the July Consumer Price Index Wednesday morning, with a soft July employment report last week increasing the market’s expectations that the Fed may leave rates unchanged at the next meeting.
Additionally, investors will continue to monitor developments on the geopolitical front. President Trump said in an interview that he plans to take a “low-key” approach to Iran, favoring increased economic pressure over additional military strikes, according to Axios.
In corporate news:
- Apple (AAPL 95, -3.38, -1.1%) has tested memory chips from China’s CXMT, according to The Wall Street Journal.
- Hewlett Packard Enterprise (HPE30, +3.08, +5.8%) was upgraded to Overweight from Equal Weight at Morgan Stanley, with a price target of $69.
- Taiwan Semiconductor Manufacturing (TSM10, +0.06, +0.0%) reported July revenues rose 45% year-over-year.
Reviewing overnight developments:
Equity indices in the Asia-Pacific region began the week on a mostly higher note. Japan’s Nikkei: +2.1%, Hong Kong’s Hang Seng: +1.1%, China’s Shanghai Composite: +0.7%, India’s Sensex: +0.1%, South Korea’s Kospi: +0.7%, Australia’s ASX All Ordinaries: -0.2%.
In news:
- China’s CPI deflated again in July, causing a deceleration in the year-over-year rate to just 0.5% from 1.0% in June.
- The Bank of Japan’s latest summary of opinions showed overall hawkishness in sentiment among policymakers.
- Japanese investors sold the second-largest monthly amount of Australian bonds in June as rising JGB rates prompted repatriation of foreign investments.
- The Reserve Bank of Australia will meet overnight but a rate hike is not expected at this time.
In economic data:
- China’s July CPI -0.1% m/m (expected 0.2%; last -0.3%); 0.5% yr/yr (expected 0.8%; last 1.0%). July PPI 3.5% yr/yr (expected 3.9%; last 4.1%)
- Japan’s June Current Account surplus JPY1.40 trln (expected surplus of JPY2.50 trln; last surplus of JPY3.06 trln). July Bank Lending 5.4% yr/yr (expected 5.7%; last 5.7%). July Economy Watchers Current Index 45.7 (expected 44.6; last 44.0)
Major European indices trade just above their flat lines while the U.K.’s FTSE (-0.3%) lags with homebuilders and other consumer names among the laggards. STOXX Europe 600: +0.1%, Germany’s DAX: +0.2%, U.K.’s FTSE 100: -0.3%, France’s CAC 40: +0.1%, Italy’s FTSE MIB: +0.3%, Spain’s IBEX 35: +0.2%.
In news:
- Vistry Group is down more than 5% after it was reported that Allianz reduced credit limits on new trading agreements for suppliers of Vistry.
- Distiller Diageo outperforms after cutting its dividend and announcing a cost-savings plan.
In economic data: Eurozone’s August Sentix Investor Confidence 0.9 (expected -0.7; last -3.1)
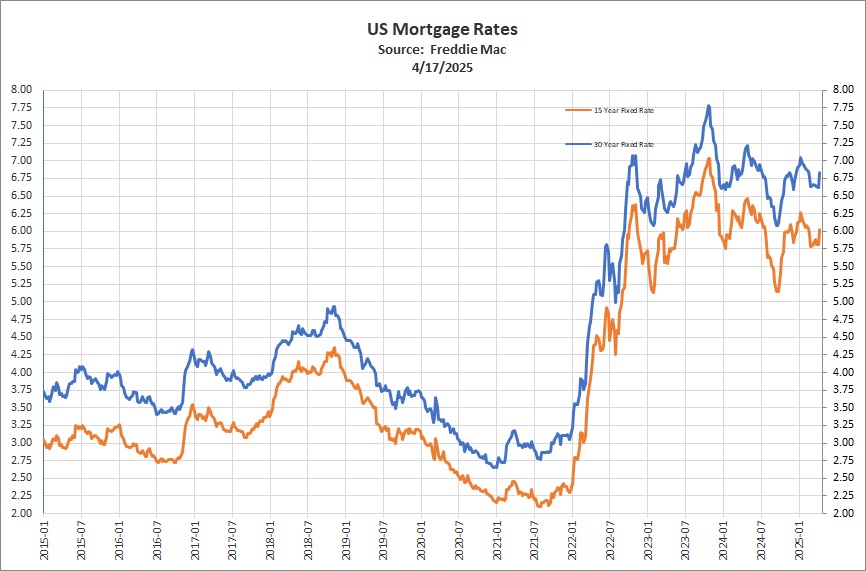
Mortgage Rates
“The 30-year fixed-rate mortgage averaged 6.69% this week,” said Sam Khater, Freddie Mac’s Chief Economist. “While mortgage rates continue to influence affordability, the housing market is showing signs of adjustment, with listing prices modestly below year-ago levels and for-sale inventory improving from the limited supply seen in recent years.”
The 30-year FRM averaged 6.69% as of August 6, 2026, up from last week when it averaged 6.66%. A year ago at this time, the 30-year FRM averaged 6.63%.
The 15-year FRM averaged 6.01%, down from last week when it averaged 6.04%. A year ago at this time, the 15-year FRM averaged 5.75%.
Selected Cryptocurrencies
| Symbol | Name | Price | 24h % | 7d % | Market Cap | Volume(24h) |
| BTC | Bitcoin | $65,066.50 | 0.24% | 4.08% | $1.3T | $15.5B |
| ETH | Ethereum | $1,918.42 | 0.04% | 4.33% | $231.51B | $6.25B |
| BNB | BNB | $604.79 | 0.20% | 3.34% | $80.53B | $1.06B |
| XRP | XRP | $1.03 | -0.27% | -2.85% | $64.6B | $875.29M |
| SOL | Solana | $76.84 | 0.54% | 6.08% | $44.73B | $1.32B |
| TRX | TRON | $0.33 | 0.47% | 1.23% | $31.43B | $323.14M |
| HYPE | Hyperliquid | $54.70 | 0.89% | 3.58% | $13.82B | $164.99M |
| DOGE | Dogecoin | $0.07 | -0.21% | 0.99% | $10.87B | $305.06M |
| LEO | UNUS SED LEO | $9.64 | -1.05% | -1.04% | $8.87B | $229.14K |
| ZEC | Zcash | $507.95 | -3.01% | 5.56% | $8.54B | $262.62M |
| XMR | Monero | $395.55 | 4.33% | 9.82% | $7.43B | $134.16M |
| ADA | Cardano | $0.20 | -0.30% | 4.95% | $7.16B | $205.76M |
| LINK | Chainlink | $8.30 | 0.09% | 1.44% | $6.21B | $198.19M |
| XLM | Stellar | $0.16 | 0.58% | -4.53% | $5.63B | $97.65M |
| BCH | Bitcoin Cash | $215.97 | -0.14% | 3.02% | $4.33B | $52.55M |
| USD1 | World Liberty Financial USD | $1.00 | 0.01% | 0.08% | $3.99B | $615.41M |
| USDe | Ethena USDe | $1.00 | 0.00% | 0.01% | $3.92B | $25.18M |
Data as of 5:00 AM PDT, Monday, August 10, 2026. Source: https://coinmarketcap.com
If you know someone age 62 or over who is feeling stressed financially and considering a reverse mortgage please send them this excellent piece with general information about reverse mortgages at: https://beaconrwa.com/reversemortgageguidebrwa/
Sources: Bill Roller, BR Capital, Inc. dba Beacon Rock Wealth Advisors American Association for Individual Investors (AAII), Associated Press, Barclays Capital, Bloomberg, Briefing.com, Citigroup, Deutsche Bank, FactSet, Financial Times, Goldman Sachs, JPMorgan Asset Management, MarketfieldAsset Management, Morgan Stanley, MSCI, Morningstar, Northern Trust, Oppenheimer Funds, PIMCO, Standard & Poor’s, StockCharts.com, The Conference Board, Thomson Reuters, T. Rowe Price, U.S. Bureau of Economic Analysis, U.S. Federal Reserve, Wall Street Journal, The Washington Post. Index performance is shown as total return, which includes dividends, with the exception of MSCI-EM, which is quoted as price return/excluding dividends. Performance for the MSCI-EAFE and MSCI-EM indexes is quoted in U.S. Dollar investor terms.
The information above has been obtained from sources considered reliable, but no representation is made as to its completeness, accuracy or timeliness. All information and opinions expressed are subject to change without notice. Information provided in this report is not intended to be, and should not be construed as, investment, legal or tax advice; and does not constitute an offer, or a solicitation of any offer, to buy or sell any security, investment or other product BR Capital, Inc. dba Beacon Rock Wealth Advisors is a registered investment advisor.